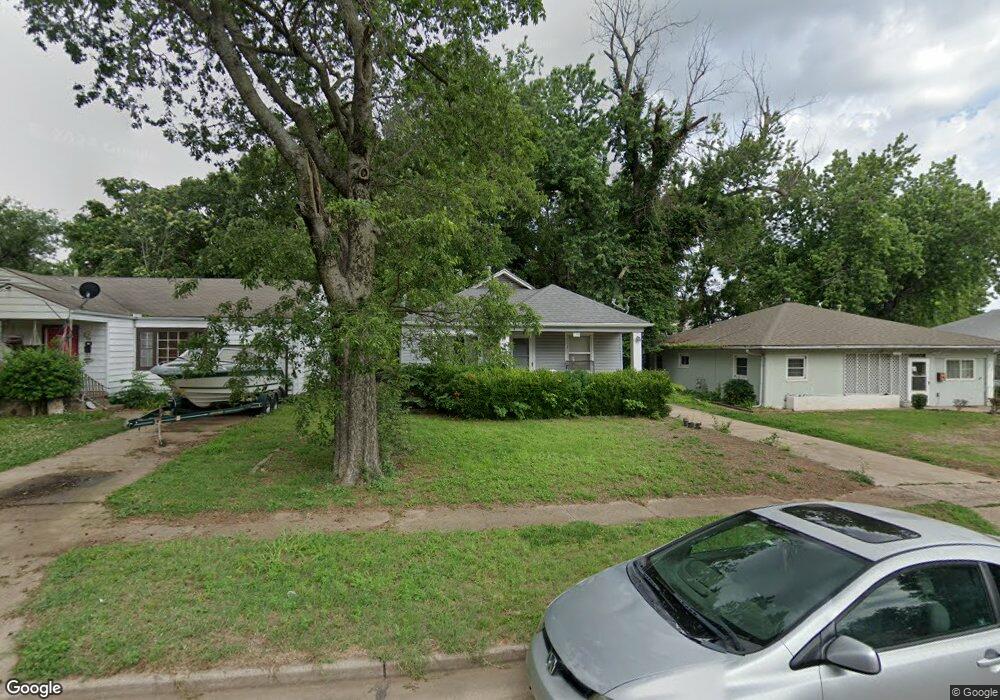
520 N 10th St Ponca City, OK 74601
Estimated Value: $94,000 - $101,000
3
Beds
1
Bath
1,222
Sq Ft
$80/Sq Ft
Est. Value
About This Home
This home is located at 520 N 10th St, Ponca City, OK 74601 and is currently estimated at $97,809, approximately $80 per square foot. 520 N 10th St is a home located in Kay County with nearby schools including Roosevelt Elementary School, Ponca City East Middle School, and Ponca City West Middle School.
Ownership History
Date
Name
Owned For
Owner Type
Purchase Details
Closed on
May 11, 2021
Sold by
Sullivan Ryan and Sullivan Shelly R
Bought by
Petsch Chad Michael and Petsch Amanda
Current Estimated Value
Home Financials for this Owner
Home Financials are based on the most recent Mortgage that was taken out on this home.
Original Mortgage
$66,930
Outstanding Balance
$60,655
Interest Rate
3.1%
Mortgage Type
New Conventional
Estimated Equity
$37,154
Purchase Details
Closed on
Apr 10, 2003
Sold by
Ryan Sullivan
Bought by
Shelly Ryan and Shelly Sullivan
Purchase Details
Closed on
Jun 2, 1998
Sold by
Eva Raymond and Eva Shaffer
Bought by
Ryan Sullivan
Purchase Details
Closed on
Jun 26, 1997
Sold by
Neal Singeltary
Bought by
Eva Roymond and Eva Shaffer
Purchase Details
Closed on
May 6, 1994
Sold by
Neal Donna M and Neal Sing
Bought by
Neal G Singletary
Create a Home Valuation Report for This Property
The Home Valuation Report is an in-depth analysis detailing your home's value as well as a comparison with similar homes in the area
Home Values in the Area
Average Home Value in this Area
Purchase History
| Date | Buyer | Sale Price | Title Company |
|---|---|---|---|
| Petsch Chad Michael | $69,000 | None Available | |
| Shelly Ryan | -- | -- | |
| Ryan Sullivan | $38,500 | -- | |
| Eva Roymond | $21,500 | -- | |
| Neal G Singletary | $20,000 | -- |
Source: Public Records
Mortgage History
| Date | Status | Borrower | Loan Amount |
|---|---|---|---|
| Open | Petsch Chad Michael | $66,930 |
Source: Public Records
Tax History Compared to Growth
Tax History
| Year | Tax Paid | Tax Assessment Tax Assessment Total Assessment is a certain percentage of the fair market value that is determined by local assessors to be the total taxable value of land and additions on the property. | Land | Improvement |
|---|---|---|---|---|
| 2024 | $757 | $7,999 | $485 | $7,514 |
| 2023 | $757 | $7,618 | $485 | $7,133 |
| 2022 | $722 | $7,590 | $485 | $7,105 |
| 2021 | $410 | $4,286 | $485 | $3,801 |
| 2020 | $304 | $4,207 | $485 | $3,722 |
| 2019 | $295 | $4,085 | $485 | $3,600 |
| 2018 | $299 | $4,085 | $485 | $3,600 |
| 2017 | $302 | $4,085 | $485 | $3,600 |
| 2016 | $305 | $4,085 | $485 | $3,600 |
| 2015 | $297 | $3,986 | $347 | $3,639 |
| 2014 | $310 | $4,172 | $347 | $3,825 |
Source: Public Records
Map
Nearby Homes
- 214 Virginia Ave
- 213 N 10th St
- 216 N 12th St Unit 840
- 525 Monument Rd
- 310 N 7th St Unit 660
- 410 Drake Dr
- 409 N 5th St
- 202 N 7th St
- 106 Elmwood Ave
- 121 Hillside Ave
- 417 N 3rd St
- 800 Sugar Maple Dr
- 1013 N 7th St
- 920 N 4th St
- 310 S 9th St
- 734 E Albany Ave
- 408 S 4th St
- 1412 Donahoe Dr
- 1008 N 1st St
- 505 N Pine St
- 524 N 10th St
- 518 N 10th St
- 528 N 10th St
- 512 N 10th St Unit 140
- 523 N 9th St
- 508 N 10th St Unit 140
- 521 N 9th St
- 525 N 9th St
- 513 N 9th St
- 521 N 10th St
- 517 N 10th St
- 525 N 10th St
- 509 N 9th St Unit 140
- 533 N 9th St
- 529 N 9th St
- 513 N 10th St
- 529 N 10th St
- 919 E Hazel Ave
- 509 N 10th St Unit 840
- 537 N 9th St