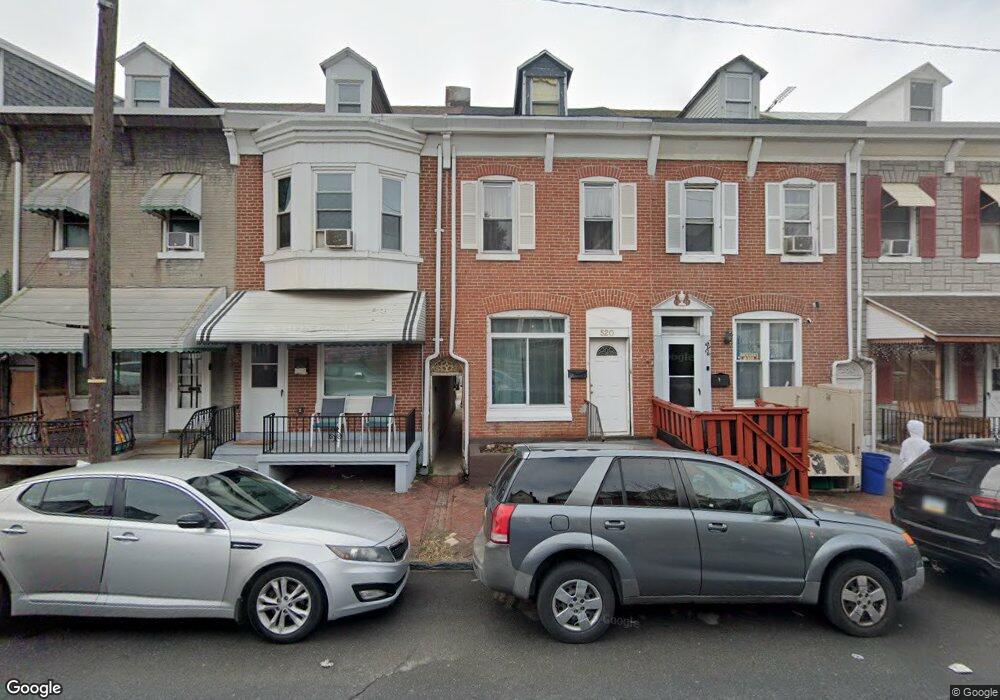
520 N 11th St Reading, PA 19604
Southeast Reading NeighborhoodEstimated Value: $111,000 - $193,000
3
Beds
1
Bath
1,431
Sq Ft
$105/Sq Ft
Est. Value
About This Home
This home is located at 520 N 11th St, Reading, PA 19604 and is currently estimated at $149,686, approximately $104 per square foot. 520 N 11th St is a home located in Berks County with nearby schools including Tenth & Green El School, Central Middle School, and Reading Senior High School.
Ownership History
Date
Name
Owned For
Owner Type
Purchase Details
Closed on
Oct 2, 2014
Sold by
Jackson Leisure Financial Services Llc
Bought by
Bashir Muhammad M
Current Estimated Value
Purchase Details
Closed on
Mar 24, 2011
Sold by
Sos Rentals Llc
Bought by
Jackson Leisure Financial Services Llc
Purchase Details
Closed on
Oct 20, 2006
Sold by
Rosales Lidoine Pita
Bought by
Sos Rentals Llc
Home Financials for this Owner
Home Financials are based on the most recent Mortgage that was taken out on this home.
Original Mortgage
$42,400
Interest Rate
6.87%
Mortgage Type
Adjustable Rate Mortgage/ARM
Create a Home Valuation Report for This Property
The Home Valuation Report is an in-depth analysis detailing your home's value as well as a comparison with similar homes in the area
Home Values in the Area
Average Home Value in this Area
Purchase History
| Date | Buyer | Sale Price | Title Company |
|---|---|---|---|
| Bashir Muhammad M | $11,000 | None Available | |
| Jackson Leisure Financial Services Llc | $1,900 | None Available | |
| Sos Rentals Llc | $49,000 | None Available |
Source: Public Records
Mortgage History
| Date | Status | Borrower | Loan Amount |
|---|---|---|---|
| Previous Owner | Sos Rentals Llc | $42,400 |
Source: Public Records
Tax History Compared to Growth
Tax History
| Year | Tax Paid | Tax Assessment Tax Assessment Total Assessment is a certain percentage of the fair market value that is determined by local assessors to be the total taxable value of land and additions on the property. | Land | Improvement |
|---|---|---|---|---|
| 2025 | $806 | $29,700 | $9,800 | $19,900 |
| 2024 | $1,319 | $29,700 | $9,800 | $19,900 |
| 2023 | $1,298 | $29,700 | $9,800 | $19,900 |
| 2022 | $1,298 | $29,700 | $9,800 | $19,900 |
| 2021 | $1,298 | $29,700 | $9,800 | $19,900 |
| 2020 | $1,285 | $29,700 | $9,800 | $19,900 |
| 2019 | $1,285 | $29,700 | $9,800 | $19,900 |
| 2018 | $1,285 | $29,700 | $9,800 | $19,900 |
| 2017 | $1,277 | $29,700 | $9,800 | $19,900 |
| 2016 | $729 | $29,700 | $9,800 | $19,900 |
| 2015 | $729 | $29,700 | $9,800 | $19,900 |
| 2014 | $671 | $29,700 | $9,800 | $19,900 |
Source: Public Records
Map
Nearby Homes