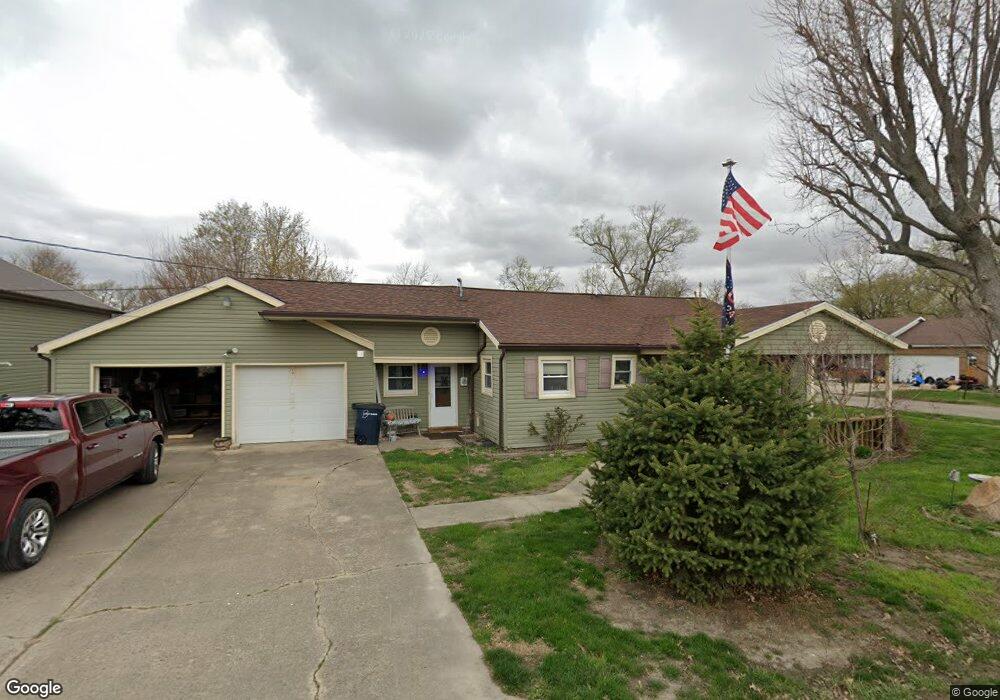
520 N 24th St Elwood, IN 46036
Estimated Value: $144,000 - $161,000
3
Beds
1
Bath
1,350
Sq Ft
$112/Sq Ft
Est. Value
About This Home
This home is located at 520 N 24th St, Elwood, IN 46036 and is currently estimated at $151,170, approximately $111 per square foot. 520 N 24th St is a home located in Madison County with nearby schools including Elwood Elementary School, Elwood Intermediate School, and Elwood Junior-Senior High School.
Ownership History
Date
Name
Owned For
Owner Type
Purchase Details
Closed on
Jul 28, 2014
Sold by
Lineberry Merrill Vaughn and Jackson Lucinda R
Bought by
Gregory Jerry A and Gregory Pamela K
Current Estimated Value
Home Financials for this Owner
Home Financials are based on the most recent Mortgage that was taken out on this home.
Original Mortgage
$48,900
Outstanding Balance
$37,015
Interest Rate
4.15%
Mortgage Type
New Conventional
Estimated Equity
$114,155
Create a Home Valuation Report for This Property
The Home Valuation Report is an in-depth analysis detailing your home's value as well as a comparison with similar homes in the area
Home Values in the Area
Average Home Value in this Area
Purchase History
| Date | Buyer | Sale Price | Title Company |
|---|---|---|---|
| Gregory Jerry A | -- | -- |
Source: Public Records
Mortgage History
| Date | Status | Borrower | Loan Amount |
|---|---|---|---|
| Open | Gregory Jerry A | $48,900 |
Source: Public Records
Tax History Compared to Growth
Tax History
| Year | Tax Paid | Tax Assessment Tax Assessment Total Assessment is a certain percentage of the fair market value that is determined by local assessors to be the total taxable value of land and additions on the property. | Land | Improvement |
|---|---|---|---|---|
| 2025 | $744 | $74,400 | $5,500 | $68,900 |
| 2024 | $744 | $74,400 | $5,500 | $68,900 |
| 2023 | $692 | $68,000 | $5,300 | $62,700 |
| 2022 | $671 | $67,700 | $4,900 | $62,800 |
| 2021 | $597 | $60,300 | $4,800 | $55,500 |
| 2020 | $566 | $55,700 | $4,500 | $51,200 |
| 2019 | $553 | $54,400 | $4,500 | $49,900 |
| 2018 | $543 | $51,600 | $4,500 | $47,100 |
| 2017 | $508 | $51,100 | $4,500 | $46,600 |
| 2016 | $178 | $23,100 | $4,300 | $18,800 |
| 2014 | $529 | $25,800 | $4,500 | $21,300 |
| 2013 | $529 | $25,800 | $4,500 | $21,300 |
Source: Public Records
Map
Nearby Homes