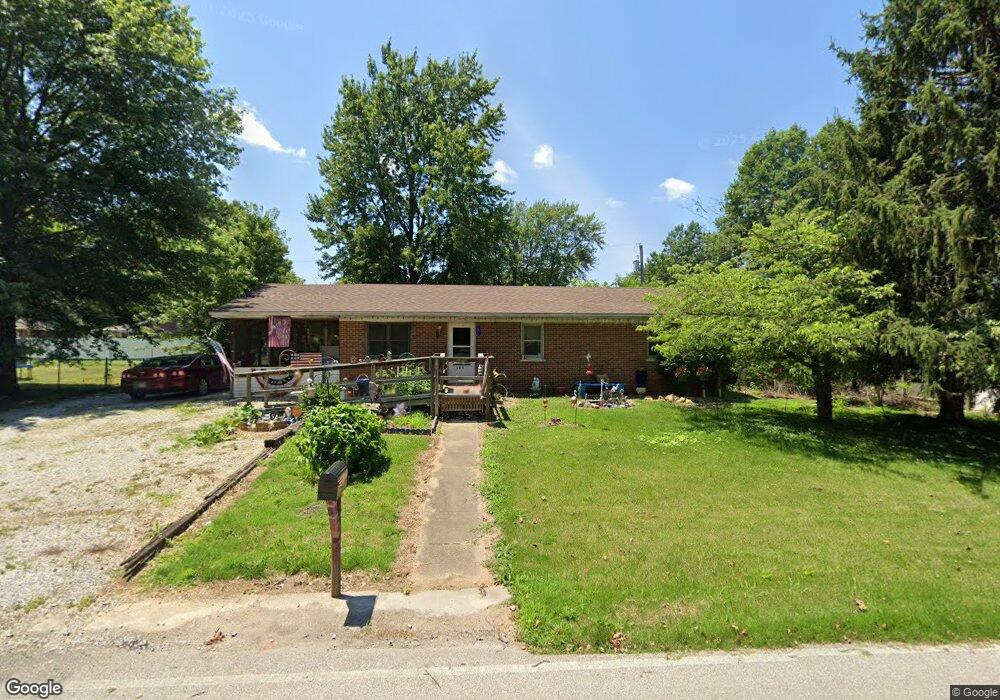
520 N 4th St Chandler, IN 47610
Estimated Value: $156,000 - $188,000
3
Beds
1
Bath
1,008
Sq Ft
$175/Sq Ft
Est. Value
About This Home
This home is located at 520 N 4th St, Chandler, IN 47610 and is currently estimated at $176,539, approximately $175 per square foot. 520 N 4th St is a home located in Warrick County with nearby schools including Chandler Elementary School, Castle North Middle School, and Boonville Middle School.
Ownership History
Date
Name
Owned For
Owner Type
Purchase Details
Closed on
Oct 16, 2015
Sold by
Reynolds Lawana M Adams
Bought by
Reynolds Jeffrey and Adams Reynolds Lawana M
Current Estimated Value
Purchase Details
Closed on
Oct 10, 2015
Sold by
Adams Lawana M
Bought by
Adams Raynolds Lawana M
Create a Home Valuation Report for This Property
The Home Valuation Report is an in-depth analysis detailing your home's value as well as a comparison with similar homes in the area
Home Values in the Area
Average Home Value in this Area
Purchase History
| Date | Buyer | Sale Price | Title Company |
|---|---|---|---|
| Reynolds Jeffrey | -- | None Available | |
| Adams Raynolds Lawana M | -- | None Available |
Source: Public Records
Tax History Compared to Growth
Tax History
| Year | Tax Paid | Tax Assessment Tax Assessment Total Assessment is a certain percentage of the fair market value that is determined by local assessors to be the total taxable value of land and additions on the property. | Land | Improvement |
|---|---|---|---|---|
| 2024 | $1,071 | $129,200 | $12,700 | $116,500 |
| 2023 | $960 | $125,800 | $12,700 | $113,100 |
| 2022 | $981 | $118,100 | $13,000 | $105,100 |
| 2021 | $761 | $94,500 | $10,200 | $84,300 |
| 2020 | $704 | $89,500 | $11,600 | $77,900 |
| 2019 | $589 | $82,900 | $10,800 | $72,100 |
| 2018 | $502 | $78,100 | $10,800 | $67,300 |
| 2017 | $487 | $77,000 | $10,800 | $66,200 |
| 2016 | $1,583 | $74,900 | $10,800 | $64,100 |
| 2014 | $139 | $74,500 | $12,600 | $61,900 |
| 2013 | $65 | $70,300 | $12,600 | $57,700 |
Source: Public Records
Map
Nearby Homes
- 521 E Monroe Ave
- 817 N Illinois St
- 601 E Mary St
- 302 Green Valley Dr
- 214 E Washington St
- 125 Cortez Ct
- 322 S Second St
- 410 S State St
- 230 W Walnut St
- 509 Inderrieden Rd
- 1922 Hewins Rd
- 1229 Saddlebrooke Cir
- 1214 Saddlebrooke Cir
- 1054 Saddlebrooke Cir
- 0 Gardner Rd
- 346 Fuquay Rd
- 450 Mallard Cir
- 435 Mallard Cir
- 7999 Heim Rd
- 4516 Sierra Dr