NOT LISTED FOR SALE

520 N Lime St Elizabethtown, PA 17022

Estimated Value: $367,000 - $416,000

3 Beds
2 Baths
2,264 Sq Ft
$172/Sq Ft Est. Value

Last Sold May 30, 2018

Last sale price $249,900 $110 Per Sq Ft

Est. 56% increase in value since last sale

Current estimated payment $2,489/month

About This Home

As of May 2018

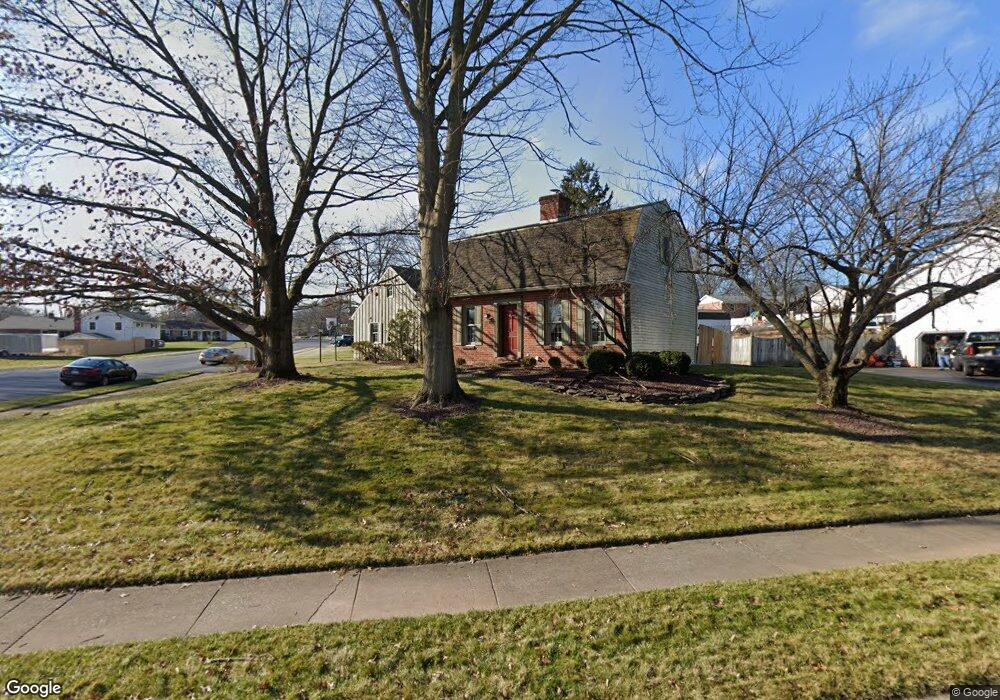
Beautiful home, tastefully decorated on a big corner lot. Fantastic Neighborhood. Easy access to highway. Finished lower level. Don't miss this one!

Ownership History

Date Name Owned For Owner Type

Purchase Details

Listed on
Apr 2, 2018
Closed on
May 30, 2018
Sold by
Yohn Cara Ficher
Bought by
Simmons David B and Simmons Tara E
Seller's Agent
dave price
Berkshire Hathaway HomeServices Homesale Realty
Buyer's Agent
Brittany Garner
Life Changes Realty Group
List Price
$249,900
Sold Price
$249,900
Current Estimated Value
$389,482

Home Financials for this Owner

Home Financials are based on the most recent Mortgage that was taken out on this home.
Estimated Appreciation
$139,582
Avg. Annual Appreciation
6.21%
Original Mortgage
$222,900
Outstanding Balance
$192,335
Interest Rate
4.4%
Mortgage Type
New Conventional
Estimated Equity
$197,147

Purchase Details

Closed on
Mar 4, 2016
Sold by
Fischer Paul M and Fischer Patricia
Bought by
Yohn Cara Fischer
Source: Public Records

Range of Values:

Collateral Analytics

Collateral Analytics Collateral Analytics AVMs (Automated Valuation Model) employ a number of statistical approaches combined with neighborhood-specific comparable selection guarantees the most up-to-date and precise valuations.

Not Available

Collateral Analytics does not have data for the current month. Please view the chart for historical values.

ICE

ICE Mortgage Technology ICE Mortgage Technology’s AVM (Automated Valuation Model) is a state-of-the-art online residential property valuation tool that provides a quick and accurate estimate of the value of almost any home in the U.S.

Not Available

ICE Mortgage Technology does not have data for the current month. Please view the chart for historical values.

First American

First American First American Data & Analytics’ next-generation AVM combines unrivaled data assets with a blended ensemble of valuation models to produce highly accurate, reliable valuations you can trust.

Not Available

First American does not have data for the current month. Please view the chart for historical values.

Quantarium

Quantarium Quantarium’s valuation service, repeatedly proven the industry’s most accurate and comprehensive, is supercharged with a self-learning and auto-tuning AI engine that continually becomes smarter and more accurate as it processes daily inputs from the industry’s leading RE data lake.

Not Available

Quantarium does not have data for the current month. Please view the chart for historical values.

Average Value
Not Available
List Price
Sold Price
Create a Home Valuation Report for This Property
The Home Valuation Report is an in-depth analysis detailing your home's value as well as a comparison with similar homes in the area

Home Values in the Area

Source: Public Records

Average Home Value in this Area


Source: Public Records

Purchase History

Date Buyer Sale Price Title Company
Simmons David B $249,900 None Available
Yohn Cara Fischer -- Attorney
Source: Public Records

Mortgage History

Date Status Borrower Loan Amount
Open Simmons David B $222,900
Source: Public Records

Property History

Date Event Price List to Sale Price per Sq Ft Prior Sale
05/30/2018 05/30/18 Sold $249,900 0.0% $110 / Sq Ft View Prior Sale
04/14/2018 04/14/18 Pending -- -- --
04/02/2018 04/02/18 For Sale $249,900 -- $110 / Sq Ft

Tax History Compared to Growth

Source: Public Records

Tax History

Year Tax Paid Tax Assessment Tax Assessment Total Assessment is a certain percentage of the fair market value that is determined by local assessors to be the total taxable value of land and additions on the property. Land Improvement
2025 $5,088 $181,200 $55,800 $125,400
2024 $5,088 $181,200 $55,800 $125,400
2023 $4,896 $181,200 $55,800 $125,400
2022 $4,725 $181,200 $55,800 $125,400
2021 $4,421 $181,200 $55,800 $125,400
2020 $4,421 $181,200 $55,800 $125,400
2019 $4,334 $181,200 $55,800 $125,400
2018 $3,009 $195,500 $70,100 $125,400
2017 $4,797 $164,100 $47,500 $116,600
2016 $4,781 $164,100 $47,500 $116,600
2015 $1,515 $164,100 $47,500 $116,600
2014 $2,930 $164,100 $47,500 $116,600
Source: Public Records

Agents Affiliated with this Home

  • Section Image
  • Section Image
See All Agents

Map