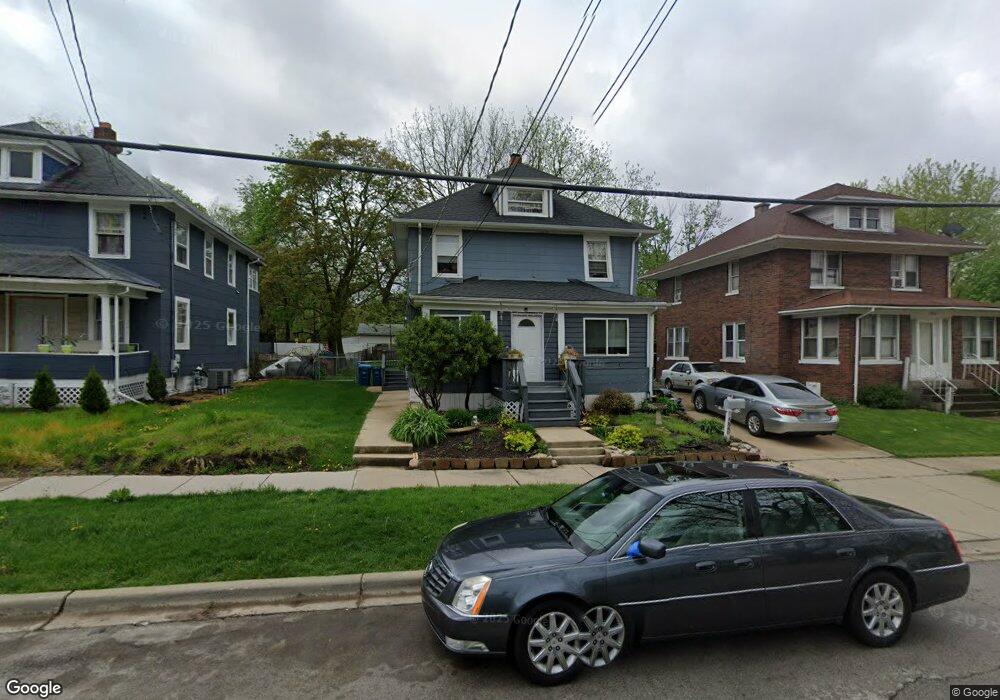
520 Plum St Aurora, IL 60506
Near West Galena NeighborhoodEstimated Value: $230,000 - $254,000
--
Bed
--
Bath
1,408
Sq Ft
$176/Sq Ft
Est. Value
About This Home
This home is located at 520 Plum St, Aurora, IL 60506 and is currently estimated at $247,309, approximately $175 per square foot. 520 Plum St is a home located in Kane County with nearby schools including Greenman Elementary School, Jefferson Middle School, and West Aurora High School.
Ownership History
Date
Name
Owned For
Owner Type
Purchase Details
Closed on
Nov 19, 2024
Sold by
Hronopoulos Maria
Bought by
Madrigal Juan J Gutierrez and Mendez Cecilia Aguiniga
Current Estimated Value
Home Financials for this Owner
Home Financials are based on the most recent Mortgage that was taken out on this home.
Original Mortgage
$243,508
Interest Rate
6.72%
Mortgage Type
FHA
Purchase Details
Closed on
Aug 29, 1996
Sold by
American National Bk & Tr Co Of Chicago
Bought by
Hronopoulos Maria
Purchase Details
Closed on
Oct 13, 1995
Sold by
Lies John M and Simantz Donald J
Bought by
American National Bk & Tr Co Of Chicago
Create a Home Valuation Report for This Property
The Home Valuation Report is an in-depth analysis detailing your home's value as well as a comparison with similar homes in the area
Home Values in the Area
Average Home Value in this Area
Purchase History
| Date | Buyer | Sale Price | Title Company |
|---|---|---|---|
| Madrigal Juan J Gutierrez | -- | Fidelity National Title | |
| Hronopoulos Maria | $75,000 | Chicago Title Insurance Co | |
| American National Bk & Tr Co Of Chicago | $65,000 | Chicago Title Insurance Co |
Source: Public Records
Mortgage History
| Date | Status | Borrower | Loan Amount |
|---|---|---|---|
| Previous Owner | Madrigal Juan J Gutierrez | $243,508 |
Source: Public Records
Tax History
| Year | Tax Paid | Tax Assessment Tax Assessment Total Assessment is a certain percentage of the fair market value that is determined by local assessors to be the total taxable value of land and additions on the property. | Land | Improvement |
|---|---|---|---|---|
| 2024 | $4,982 | $62,924 | $5,726 | $57,198 |
| 2023 | $4,816 | $56,222 | $5,116 | $51,106 |
| 2022 | $4,363 | $49,283 | $4,668 | $44,615 |
| 2021 | $4,192 | $45,883 | $4,346 | $41,537 |
| 2020 | $3,990 | $42,619 | $4,037 | $38,582 |
| 2019 | $3,861 | $39,487 | $3,740 | $35,747 |
| 2018 | $3,468 | $34,744 | $3,459 | $31,285 |
| 2017 | $3,280 | $31,870 | $3,187 | $28,683 |
| 2016 | $3,118 | $29,352 | $2,732 | $26,620 |
| 2015 | -- | $26,334 | $2,349 | $23,985 |
| 2014 | -- | $23,846 | $2,159 | $21,687 |
| 2013 | -- | $25,151 | $2,063 | $23,088 |
Source: Public Records
Map
Nearby Homes
- 523 N Highland Ave
- 603 N May St
- 519 N View St
- 507 W Park Ave
- 415 Blackhawk St
- 418 W Illinois Ave
- 514 Spruce St
- 109 N May St
- 932 W New York St
- 359 W Galena Blvd
- 355 Lawndale Ave
- 659 W Downer Place
- 450 W Downer Place Unit 4C
- 810 W Galena Blvd
- 837 Taylor Ave
- 256 W Downer Place
- 231-233 Williams St
- 930 W New York St Unit 932
- 138 Woodlawn Ave
- 847 Foran Ln
Your Personal Tour Guide
Ask me questions while you tour the home.