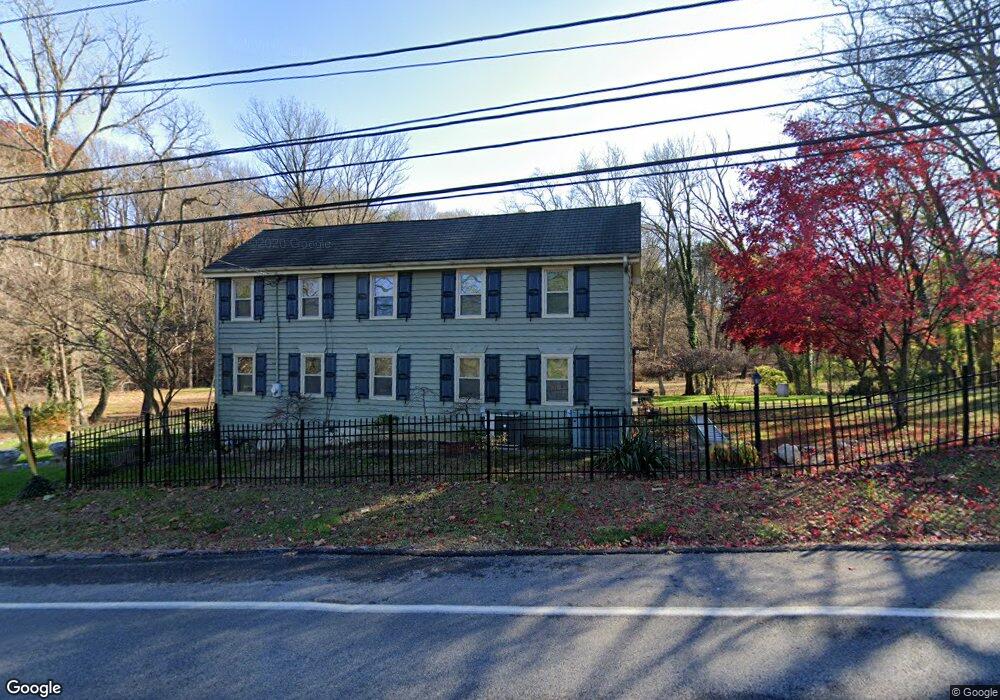
520 Plush Mill Rd Wallingford, PA 19086
Estimated Value: $936,000 - $1,011,000
4
Beds
4
Baths
3,647
Sq Ft
$267/Sq Ft
Est. Value
About This Home
This home is located at 520 Plush Mill Rd, Wallingford, PA 19086 and is currently estimated at $973,369, approximately $266 per square foot. 520 Plush Mill Rd is a home located in Delaware County with nearby schools including Swarthmore-Rutledge School, Strath Haven Middle School, and Strath Haven High School.
Ownership History
Date
Name
Owned For
Owner Type
Purchase Details
Closed on
Mar 5, 2010
Sold by
Cartus Financial Corporation
Bought by
Nerz Kevin J and Nerz Nga P
Current Estimated Value
Home Financials for this Owner
Home Financials are based on the most recent Mortgage that was taken out on this home.
Original Mortgage
$399,950
Outstanding Balance
$264,946
Interest Rate
4.97%
Mortgage Type
New Conventional
Estimated Equity
$708,423
Purchase Details
Closed on
Dec 8, 2009
Sold by
Lafountain Andrew R and Lafountain Andrea P
Bought by
Cartus Financial Corporation
Purchase Details
Closed on
Oct 26, 2001
Sold by
Johnston Donald and Koblenzer Frances
Bought by
Lafountain Andrew R and Lafountain Andrea P
Home Financials for this Owner
Home Financials are based on the most recent Mortgage that was taken out on this home.
Original Mortgage
$275,000
Interest Rate
6.7%
Mortgage Type
Purchase Money Mortgage
Create a Home Valuation Report for This Property
The Home Valuation Report is an in-depth analysis detailing your home's value as well as a comparison with similar homes in the area
Home Values in the Area
Average Home Value in this Area
Purchase History
| Date | Buyer | Sale Price | Title Company |
|---|---|---|---|
| Nerz Kevin J | $499,975 | None Available | |
| Cartus Financial Corporation | $550,000 | None Available | |
| Lafountain Andrew R | $350,000 | Fidelity National Title Ins |
Source: Public Records
Mortgage History
| Date | Status | Borrower | Loan Amount |
|---|---|---|---|
| Open | Nerz Kevin J | $399,950 | |
| Previous Owner | Lafountain Andrew R | $275,000 | |
| Closed | Lafountain Andrew R | $57,500 |
Source: Public Records
Tax History Compared to Growth
Tax History
| Year | Tax Paid | Tax Assessment Tax Assessment Total Assessment is a certain percentage of the fair market value that is determined by local assessors to be the total taxable value of land and additions on the property. | Land | Improvement |
|---|---|---|---|---|
| 2025 | $14,884 | $417,480 | $176,880 | $240,600 |
| 2024 | $14,884 | $417,480 | $176,880 | $240,600 |
| 2023 | $14,301 | $417,480 | $176,880 | $240,600 |
| 2022 | $13,998 | $417,480 | $176,880 | $240,600 |
| 2021 | $22,741 | $417,480 | $176,880 | $240,600 |
| 2020 | $13,791 | $237,980 | $71,590 | $166,390 |
| 2019 | $13,411 | $237,980 | $71,590 | $166,390 |
| 2018 | $13,150 | $237,980 | $0 | $0 |
| 2017 | $12,788 | $237,980 | $0 | $0 |
| 2016 | $1,306 | $237,980 | $0 | $0 |
| 2015 | $1,306 | $237,980 | $0 | $0 |
| 2014 | $1,306 | $237,980 | $0 | $0 |
Source: Public Records
Map
Nearby Homes
- 606 Ogden Ave
- 411 Marie Dr
- 519 Walnut Ln Unit 1
- 719 Pine Ridge Rd
- 1521 Snead Green Unit Z194
- 651 N Chester Rd
- 1433 Country Club Dr Unit T214
- 1366 Nicklaus Dr Unit O125
- 25 Green Valley Rd
- 110 Park Ave Unit 370
- 110 Park Ave Unit 350
- 110 Park Ave Unit 250
- 110 Park Ave Unit 320
- 110 Park Ave Unit 440
- 110 Park Ave Unit 460
- 110 Park Ave Unit 430
- 110 Park Ave Unit 210
- 110 Park Ave Unit 340
- 208 Martroy Ln
- 801 UNIT 701 Yale Ave
- 512 Plush Mill Rd
- 445 Rogers Ln
- 501 Plush Mill Rd
- 1521 Wallingford Rd
- 431 Rogers Ln
- 1489 Baltimore Pike Unit 109
- 1489 Baltimore Pike
- 1489 Baltimore Pike Unit 305 BLDG 3
- 1515 Wallingford Rd
- 1445 Wallingford Rd
- 1511 Wallingford Rd
- 418 Rogers Ln
- 615 Elm Ave
- 1461 Wallingford Rd
- 1513 Wallingford Rd
- 625 Elm Ave
- 421 Rogers Ln
- 416 Rogers Ln
- 740 Ogden Ave
- 609 Elm Ave