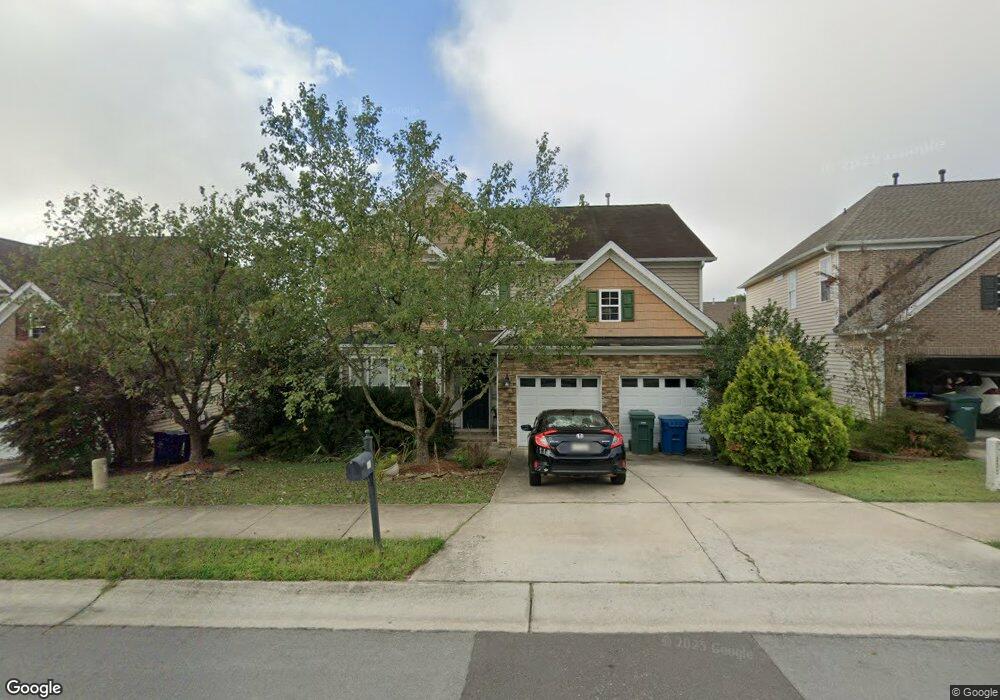
520 Poplar St Durham, NC 27703
Eastern Durham NeighborhoodEstimated Value: $448,910 - $487,000
4
Beds
3
Baths
2,626
Sq Ft
$179/Sq Ft
Est. Value
About This Home
This home is located at 520 Poplar St, Durham, NC 27703 and is currently estimated at $470,228, approximately $179 per square foot. 520 Poplar St is a home located in Durham County with nearby schools including Spring Valley Elementary School, John W Neal Middle School, and Southern School of Energy & Sustainability.
Ownership History
Date
Name
Owned For
Owner Type
Purchase Details
Closed on
Sep 22, 2017
Sold by
Equity Trust Co
Bought by
Equity Trust Co
Current Estimated Value
Home Financials for this Owner
Home Financials are based on the most recent Mortgage that was taken out on this home.
Original Mortgage
$162,500
Outstanding Balance
$126,404
Interest Rate
3.89%
Mortgage Type
Commercial
Estimated Equity
$343,824
Purchase Details
Closed on
Apr 27, 2017
Sold by
Church Tony Dean and Church Alison
Bought by
Equity Trust Company
Purchase Details
Closed on
Dec 17, 2010
Sold by
Church Tony Dean
Bought by
Church Tony Dean
Home Financials for this Owner
Home Financials are based on the most recent Mortgage that was taken out on this home.
Original Mortgage
$220,592
Interest Rate
4.42%
Mortgage Type
New Conventional
Purchase Details
Closed on
Sep 24, 2007
Sold by
Church Angelina
Bought by
Church Tony Dean
Purchase Details
Closed on
May 30, 2007
Sold by
St Lawrence Homes Inc
Bought by
Church Tony Dean and Church Angelina
Home Financials for this Owner
Home Financials are based on the most recent Mortgage that was taken out on this home.
Original Mortgage
$226,000
Interest Rate
6.12%
Mortgage Type
New Conventional
Create a Home Valuation Report for This Property
The Home Valuation Report is an in-depth analysis detailing your home's value as well as a comparison with similar homes in the area
Home Values in the Area
Average Home Value in this Area
Purchase History
| Date | Buyer | Sale Price | Title Company |
|---|---|---|---|
| Equity Trust Co | -- | None Available | |
| Equity Trust Company | $250,000 | None Available | |
| Church Tony Dean | -- | None Available | |
| Church Tony Dean | -- | None Available | |
| Church Tony Dean | -- | None Available | |
| Church Tony Dean | -- | None Available | |
| Church Tony Dean | $226,000 | None Available |
Source: Public Records
Mortgage History
| Date | Status | Borrower | Loan Amount |
|---|---|---|---|
| Open | Equity Trust Co | $162,500 | |
| Previous Owner | Church Tony Dean | $220,592 | |
| Previous Owner | Church Tony Dean | $226,000 |
Source: Public Records
Tax History
| Year | Tax Paid | Tax Assessment Tax Assessment Total Assessment is a certain percentage of the fair market value that is determined by local assessors to be the total taxable value of land and additions on the property. | Land | Improvement |
|---|---|---|---|---|
| 2025 | $4,668 | $470,885 | $100,625 | $370,260 |
| 2024 | $3,855 | $276,367 | $51,660 | $224,707 |
| 2023 | $3,620 | $276,367 | $51,660 | $224,707 |
| 2022 | $3,537 | $276,367 | $51,660 | $224,707 |
| 2021 | $3,521 | $276,367 | $51,660 | $224,707 |
| 2020 | $3,438 | $276,367 | $51,660 | $224,707 |
| 2019 | $3,438 | $276,367 | $51,660 | $224,707 |
| 2018 | $3,161 | $232,991 | $45,920 | $187,071 |
| 2017 | $3,137 | $232,991 | $45,920 | $187,071 |
| 2016 | $3,031 | $232,991 | $45,920 | $187,071 |
| 2015 | $2,961 | $213,881 | $39,199 | $174,682 |
| 2014 | $2,961 | $213,881 | $39,199 | $174,682 |
Source: Public Records
Map
Nearby Homes
- 807 Outlaw Ave
- 6 Dawson Ct
- 819 Ember Dr
- 2208 Gilman St
- 503 Plumleaf Ln
- 1112 Blackthorn Ln
- 806 Poplar St
- 528 Plumleaf Ln
- 428 Holly Blossom Dr
- 442 Gus Rd
- 1204 Constellation Cir
- 1202 Constellation Cir
- 1126 Constellation Cir
- 621 Wellwater Ave
- 1118 Constellation Cir
- 1116 Constellation Cir
- 601 Crossing Dr
- 1009 Frisco Ct
- 1050 Constellation Cir
- 1041 Constellation Cir
Your Personal Tour Guide
Ask me questions while you tour the home.