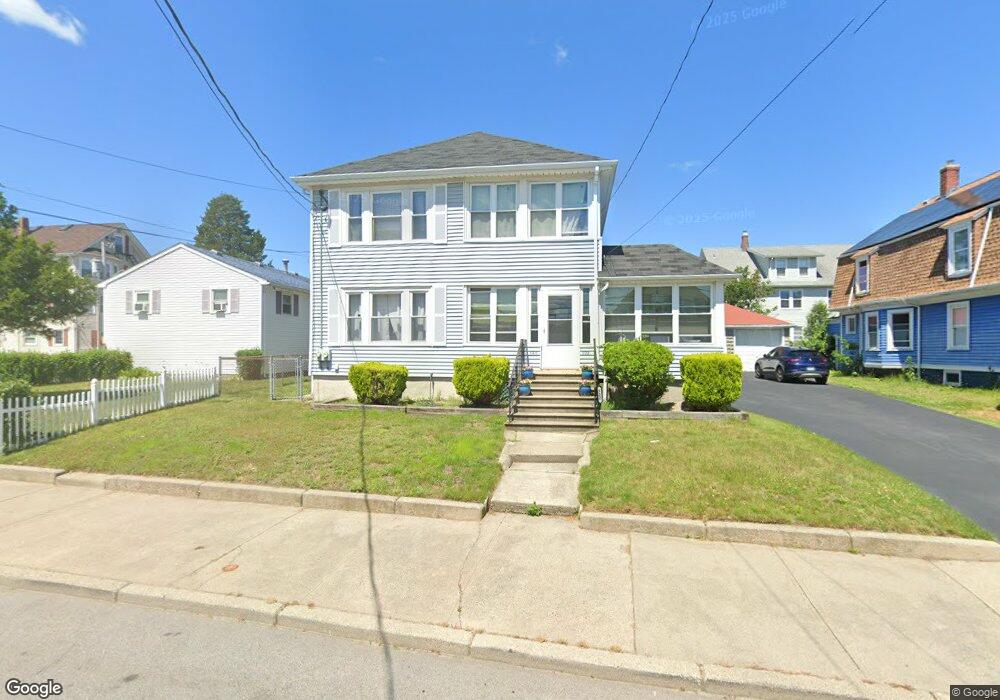
520 Power Rd Pawtucket, RI 02860
Fairlawn NeighborhoodEstimated Value: $487,492 - $612,000
4
Beds
2
Baths
2,208
Sq Ft
$244/Sq Ft
Est. Value
About This Home
This home is located at 520 Power Rd, Pawtucket, RI 02860 and is currently estimated at $538,373, approximately $243 per square foot. 520 Power Rd is a home located in Providence County with nearby schools including Blackstone Valley Prep Upper Elementary School, Blackstone Valley Prep Junior High School, and Bishop Keough Regional High School.
Ownership History
Date
Name
Owned For
Owner Type
Purchase Details
Closed on
Dec 20, 2022
Sold by
King Paul
Bought by
King Elizabeth
Current Estimated Value
Home Financials for this Owner
Home Financials are based on the most recent Mortgage that was taken out on this home.
Original Mortgage
$148,872
Outstanding Balance
$143,922
Interest Rate
7.08%
Mortgage Type
Purchase Money Mortgage
Estimated Equity
$394,451
Create a Home Valuation Report for This Property
The Home Valuation Report is an in-depth analysis detailing your home's value as well as a comparison with similar homes in the area
Home Values in the Area
Average Home Value in this Area
Purchase History
| Date | Buyer | Sale Price | Title Company |
|---|---|---|---|
| King Elizabeth | $148,872 | None Available |
Source: Public Records
Mortgage History
| Date | Status | Borrower | Loan Amount |
|---|---|---|---|
| Open | King Elizabeth | $148,872 |
Source: Public Records
Tax History
| Year | Tax Paid | Tax Assessment Tax Assessment Total Assessment is a certain percentage of the fair market value that is determined by local assessors to be the total taxable value of land and additions on the property. | Land | Improvement |
|---|---|---|---|---|
| 2025 | $5,674 | $431,500 | $136,300 | $295,200 |
| 2024 | $5,325 | $431,500 | $136,300 | $295,200 |
| 2023 | $4,962 | $292,900 | $82,200 | $210,700 |
| 2022 | $4,856 | $292,900 | $82,200 | $210,700 |
| 2021 | $4,856 | $292,900 | $82,200 | $210,700 |
| 2020 | $4,253 | $203,600 | $57,700 | $145,900 |
| 2019 | $4,253 | $203,600 | $57,700 | $145,900 |
| 2018 | $4,098 | $203,600 | $57,700 | $145,900 |
| 2017 | $4,056 | $178,500 | $63,800 | $114,700 |
| 2016 | $3,907 | $178,500 | $63,800 | $114,700 |
| 2015 | $3,907 | $178,500 | $63,800 | $114,700 |
| 2014 | $3,899 | $169,100 | $63,800 | $105,300 |
Source: Public Records
Map
Nearby Homes
- 220 Francis Ave
- 2 Cobble Hill Rd
- 2 Ward Ave
- 18 Almy St
- 53 Oriole Ave
- 63 Chandler Ave
- 121 Samuel Ave
- 458 Smithfield Ave
- 16 Rufus St
- 60 Dorman Ave
- 60 Stedman Ave
- 53 Francis Ave
- 8 Arnold Ave
- 53 Samuel Ave
- 957 Mineral Spring Ave
- 11 Franklin St
- 584 Weeden St
- 1190 Charles St Unit 14
- 101 Cobble Hill Rd
- 26 Smith St
- 526 Power Rd
- 181 Chandler Ave
- 187 Chandler Ave
- 296 Owen Ave
- 189 Chandler Ave
- 308 Owen Ave
- 178-180 Chandler Ave Unit 3
- 536 Power Rd
- 508 Power Rd
- 523 Power Rd
- 515 Power Rd
- 527 Power Rd
- 193 Chandler Ave
- 184 Chandler Ave
- 538 Power Rd
- 538 Power Rd Unit 3
- 538 Power Rd
- 305 Owen Ave
- 504 Power Rd
- 310 Owen Ave
Your Personal Tour Guide
Ask me questions while you tour the home.