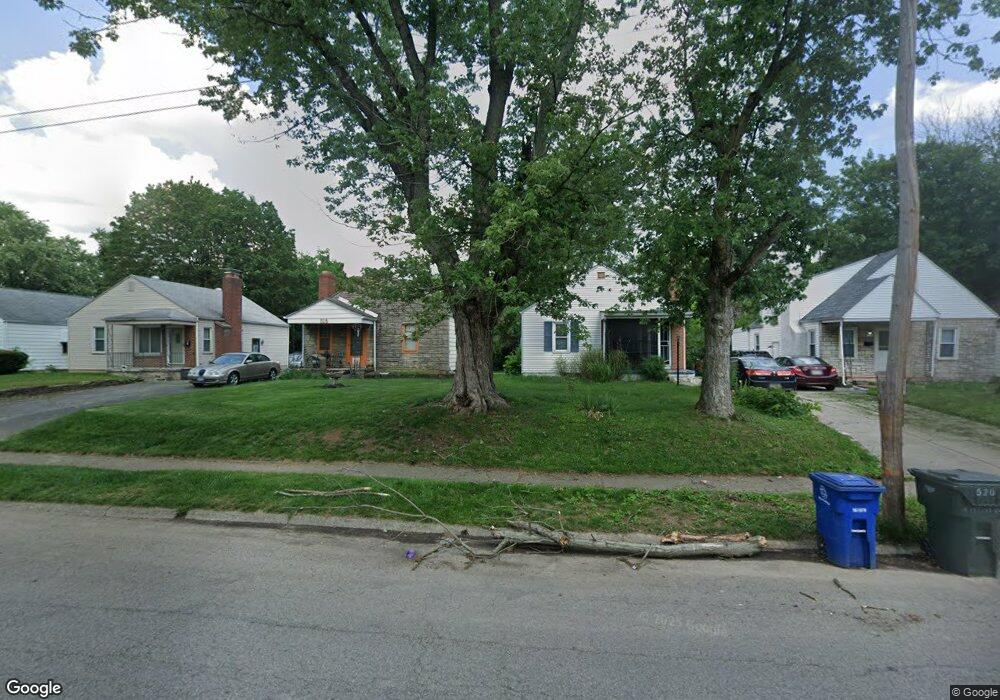
520 S Weyant Ave Columbus, OH 43213
Eastmoor NeighborhoodEstimated Value: $123,000 - $139,000
2
Beds
1
Bath
720
Sq Ft
$180/Sq Ft
Est. Value
About This Home
This home is located at 520 S Weyant Ave, Columbus, OH 43213 and is currently estimated at $129,667, approximately $180 per square foot. 520 S Weyant Ave is a home located in Franklin County with nearby schools including Fairmoor Elementary School, Johnson Park Middle School, and Walnut Ridge High School.
Ownership History
Date
Name
Owned For
Owner Type
Purchase Details
Closed on
Dec 28, 2023
Sold by
Offer Express Ltd
Bought by
New Life Property Solutions Llc
Current Estimated Value
Purchase Details
Closed on
Jan 19, 2021
Sold by
Lehman John S
Bought by
Offer Express Ltd
Purchase Details
Closed on
Jan 8, 2021
Sold by
Lehman John S
Bought by
Offer Express Ltd
Purchase Details
Closed on
Aug 7, 1998
Sold by
Stanley Thomas R
Bought by
Lehman John S
Home Financials for this Owner
Home Financials are based on the most recent Mortgage that was taken out on this home.
Original Mortgage
$54,850
Interest Rate
7.37%
Mortgage Type
VA
Purchase Details
Closed on
Sep 27, 1990
Create a Home Valuation Report for This Property
The Home Valuation Report is an in-depth analysis detailing your home's value as well as a comparison with similar homes in the area
Home Values in the Area
Average Home Value in this Area
Purchase History
| Date | Buyer | Sale Price | Title Company |
|---|---|---|---|
| New Life Property Solutions Llc | -- | Empora Title | |
| Offer Express Ltd | $45,000 | Axxis Title | |
| Offer Express Ltd | $45,000 | Axxis Title Agency Ltd | |
| Lehman John S | $52,800 | -- | |
| -- | $48,000 | -- |
Source: Public Records
Mortgage History
| Date | Status | Borrower | Loan Amount |
|---|---|---|---|
| Previous Owner | Lehman John S | $54,850 |
Source: Public Records
Tax History Compared to Growth
Tax History
| Year | Tax Paid | Tax Assessment Tax Assessment Total Assessment is a certain percentage of the fair market value that is determined by local assessors to be the total taxable value of land and additions on the property. | Land | Improvement |
|---|---|---|---|---|
| 2024 | $6,109 | $41,450 | $11,660 | $29,790 |
| 2023 | $2,203 | $41,450 | $11,660 | $29,790 |
| 2022 | $1,653 | $18,350 | $5,080 | $13,270 |
| 2021 | $953 | $18,350 | $5,080 | $13,270 |
| 2020 | $955 | $18,350 | $5,080 | $13,270 |
| 2019 | $901 | $14,850 | $4,240 | $10,610 |
| 2018 | $1,009 | $14,850 | $4,240 | $10,610 |
| 2017 | $1,067 | $14,850 | $4,240 | $10,610 |
| 2016 | $1,233 | $18,620 | $3,780 | $14,840 |
| 2015 | $1,120 | $18,620 | $3,780 | $14,840 |
| 2014 | $1,122 | $18,620 | $3,780 | $14,840 |
| 2013 | $583 | $19,600 | $3,990 | $15,610 |
Source: Public Records
Map
Nearby Homes
- 647 S Napoleon Ave
- 646 S Weyant Ave
- 708 S Waverly St
- 733 S Napoleon Ave
- 635 Elizabeth Ave
- 711 S Waverly St
- 430 S James Rd
- 622 S Ashburton Rd
- 3160 Fair Ave
- 526 Collingwood Ave
- 836 S Weyant Ave
- 201 S Weyant Ave
- 277 S James Rd
- 565 S Kellner Rd
- 247 S James Rd
- 178 S Weyant Ave
- 842 S Hampton Rd
- 864 S Waverly St
- 892 Ruby Ave
- 804 S Ashburton Rd
- 524 S Weyant Ave
- 516 S Weyant Ave
- 530 S Weyant Ave
- 510 S Weyant Ave
- 536 S Weyant Ave
- 506 S Weyant Ave
- 527 S Napoleon Ave
- 533 S Napoleon Ave
- 542 S Weyant Ave
- 500 S Weyant Ave
- 517 S Napoleon Ave
- 537 S Napoleon Ave
- 519 S Weyant Ave
- 511 S Napoleon Ave
- 523 S Weyant Ave
- 543 S Napoleon Ave
- 494 S Weyant Ave
- 548 S Weyant Ave
- 529 S Weyant Ave
- 509 S Napoleon Ave