Estimated Value: $536,242 - $591,000
4
Beds
3
Baths
1,864
Sq Ft
$301/Sq Ft
Est. Value
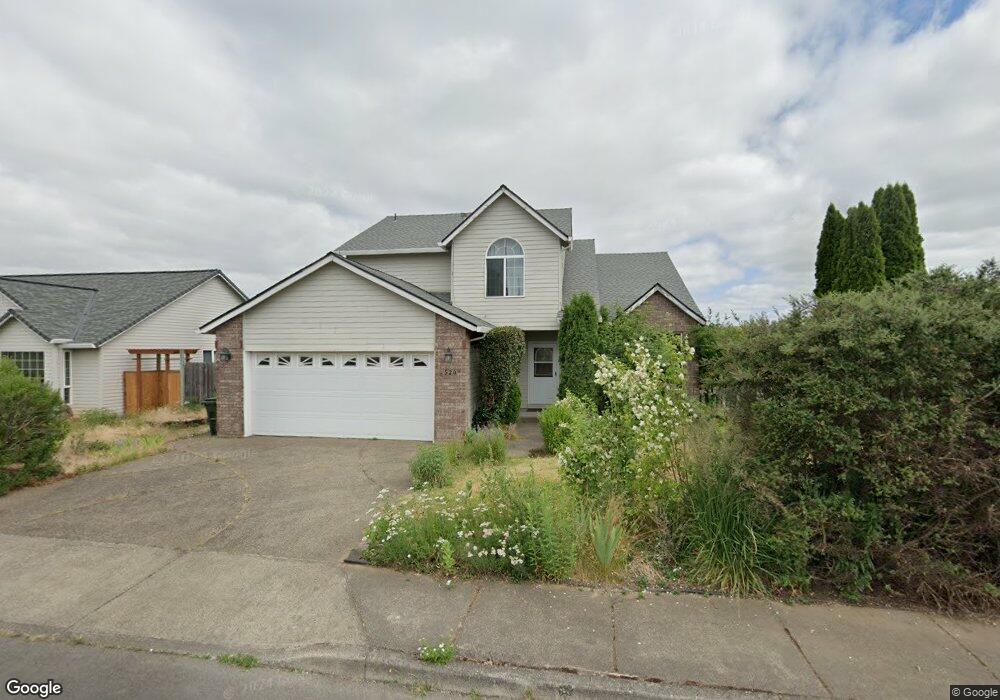
About This Home
This home is located at 520 SE 8th Ave, Canby, OR 97013 and is currently estimated at $561,811, approximately $301 per square foot. 520 SE 8th Ave is a home located in Clackamas County with nearby schools including Philander Lee Elementary School, Baker Prairie Middle School, and Canby High School.
Ownership History
Date
Name
Owned For
Owner Type
Purchase Details
Closed on
Feb 12, 2016
Sold by
Erkenbeck Eric S and Erkenbeck Kristine M
Bought by
Look Troy Andrew and Look Mariah Simon Seymour
Current Estimated Value
Home Financials for this Owner
Home Financials are based on the most recent Mortgage that was taken out on this home.
Original Mortgage
$248,000
Outstanding Balance
$197,369
Interest Rate
3.98%
Mortgage Type
New Conventional
Estimated Equity
$364,442
Purchase Details
Closed on
Nov 21, 1997
Sold by
Gordon Knutson Construction Inc
Bought by
Erkenbeck Eric S and Erkenbeck Kristine M
Home Financials for this Owner
Home Financials are based on the most recent Mortgage that was taken out on this home.
Original Mortgage
$151,600
Interest Rate
7.33%
Create a Home Valuation Report for This Property
The Home Valuation Report is an in-depth analysis detailing your home's value as well as a comparison with similar homes in the area
Home Values in the Area
Average Home Value in this Area
Purchase History
| Date | Buyer | Sale Price | Title Company |
|---|---|---|---|
| Look Troy Andrew | $310,000 | Ticor Title | |
| Erkenbeck Eric S | $189,500 | Chicago Title Insurance Co |
Source: Public Records
Mortgage History
| Date | Status | Borrower | Loan Amount |
|---|---|---|---|
| Open | Look Troy Andrew | $248,000 | |
| Previous Owner | Erkenbeck Eric S | $151,600 |
Source: Public Records
Tax History
| Year | Tax Paid | Tax Assessment Tax Assessment Total Assessment is a certain percentage of the fair market value that is determined by local assessors to be the total taxable value of land and additions on the property. | Land | Improvement |
|---|---|---|---|---|
| 2025 | $5,461 | $308,243 | -- | -- |
| 2024 | $5,308 | $299,266 | -- | -- |
| 2023 | $5,308 | $290,550 | $0 | $0 |
| 2022 | $4,882 | $282,088 | $0 | $0 |
| 2021 | $4,701 | $273,872 | $0 | $0 |
| 2020 | $4,617 | $265,896 | $0 | $0 |
| 2019 | $4,397 | $258,152 | $0 | $0 |
| 2018 | $4,299 | $250,633 | $0 | $0 |
| 2017 | $4,190 | $243,333 | $0 | $0 |
| 2016 | $4,050 | $236,246 | $0 | $0 |
Source: Public Records
Map
Nearby Homes
- 423 SE 7th Ave
- 331 SE 9th Ave
- 1380 SE 9th Ave
- 1407 SE 7th Ave
- 481 S Pine St
- 1460 SE 9th Ave
- 385 SE Township Rd
- 550 SE 5th Ave
- 1088 S Sycamore St
- 340 S Locust St
- 1018 S Holly Ct
- 1111 SE 3rd Ave Unit 15
- 574 S Ivy St
- 1804 S Locust St
- 312 SE 13th Place
- 1608 S Fern Way
- 1330 SE 13th Place
- 233 SE 3rd Ave
- 620 SE 2nd Ave
- 620 SE 2nd Ave Unit 75 Av
Your Personal Tour Guide
Ask me questions while you tour the home.