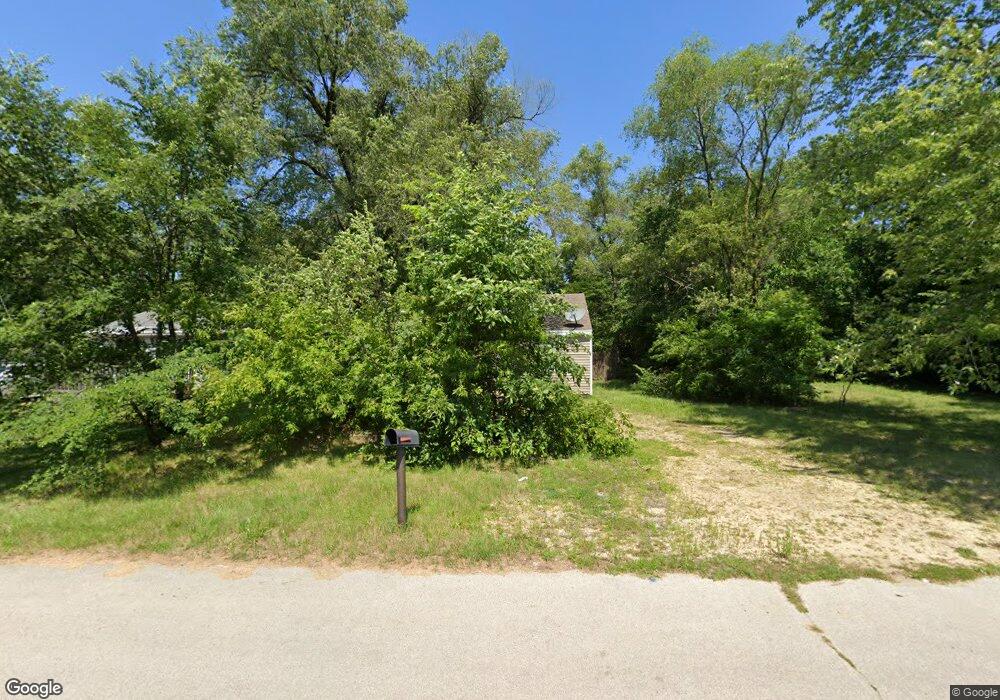
520 South Ave Rockford, IL 61109
Estimated Value: $101,000 - $106,000
2
Beds
1
Bath
884
Sq Ft
$118/Sq Ft
Est. Value
About This Home
This home is located at 520 South Ave, Rockford, IL 61109 and is currently estimated at $104,579, approximately $118 per square foot. 520 South Ave is a home located in Winnebago County with nearby schools including Riverdahl Elementary School, Rockford Environmental Science Academy, and Jefferson High School.
Ownership History
Date
Name
Owned For
Owner Type
Purchase Details
Closed on
Jul 18, 2025
Sold by
Miranda Miguel
Bought by
Ruvalcaba Reyna M
Current Estimated Value
Home Financials for this Owner
Home Financials are based on the most recent Mortgage that was taken out on this home.
Original Mortgage
$99,750
Outstanding Balance
$99,503
Interest Rate
6.99%
Mortgage Type
New Conventional
Estimated Equity
$5,076
Purchase Details
Closed on
Apr 16, 2021
Sold by
Winnebago County
Bought by
Miranda Miguel
Create a Home Valuation Report for This Property
The Home Valuation Report is an in-depth analysis detailing your home's value as well as a comparison with similar homes in the area
Home Values in the Area
Average Home Value in this Area
Purchase History
| Date | Buyer | Sale Price | Title Company |
|---|---|---|---|
| Ruvalcaba Reyna M | $105,000 | Proper Title | |
| Miranda Miguel | -- | Denzin Soltanzadeh Llc |
Source: Public Records
Mortgage History
| Date | Status | Borrower | Loan Amount |
|---|---|---|---|
| Open | Ruvalcaba Reyna M | $99,750 |
Source: Public Records
Tax History Compared to Growth
Tax History
| Year | Tax Paid | Tax Assessment Tax Assessment Total Assessment is a certain percentage of the fair market value that is determined by local assessors to be the total taxable value of land and additions on the property. | Land | Improvement |
|---|---|---|---|---|
| 2024 | $1,457 | $15,370 | $1,174 | $14,196 |
| 2023 | $488 | $4,697 | $524 | $4,173 |
| 2022 | $487 | $4,198 | $468 | $3,730 |
| 2021 | $1,310 | $10,688 | $428 | $10,260 |
| 2020 | $1,299 | $10,104 | $405 | $9,699 |
| 2019 | $1,290 | $9,630 | $386 | $9,244 |
| 2018 | $1,379 | $9,632 | $365 | $9,267 |
| 2017 | $1,368 | $9,218 | $349 | $8,869 |
| 2016 | $1,366 | $9,045 | $342 | $8,703 |
| 2015 | $1,384 | $9,045 | $342 | $8,703 |
| 2014 | $1,388 | $9,331 | $427 | $8,904 |
Source: Public Records
Map
Nearby Homes