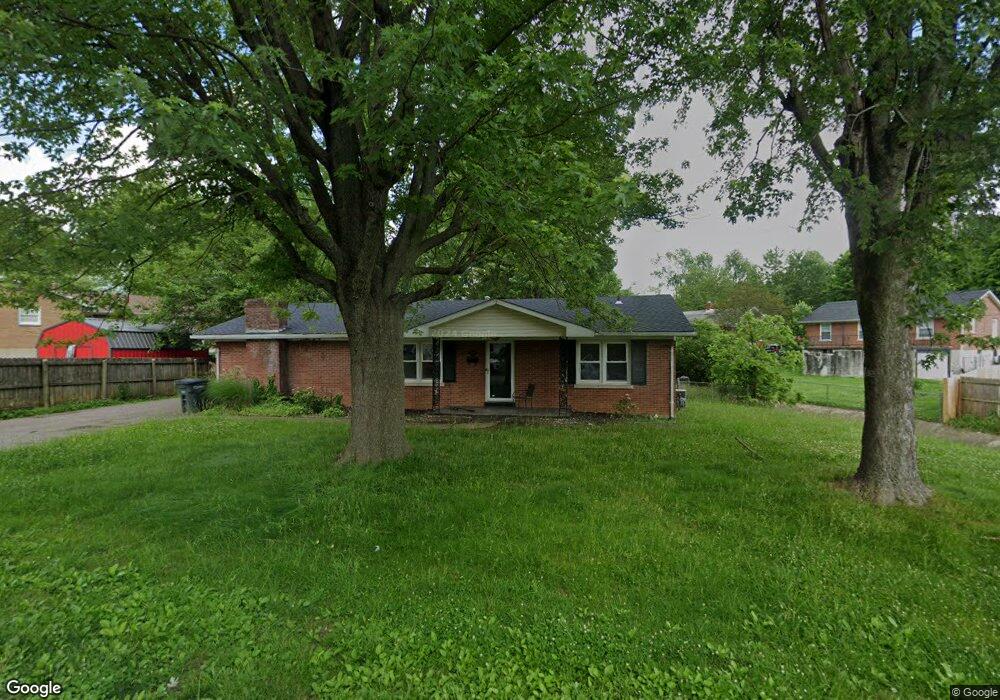
520 Spring Dr Elizabethtown, KY 42701
Estimated Value: $214,000 - $244,000
3
Beds
2
Baths
1,966
Sq Ft
$117/Sq Ft
Est. Value
About This Home
This home is located at 520 Spring Dr, Elizabethtown, KY 42701 and is currently estimated at $229,919, approximately $116 per square foot. 520 Spring Dr is a home located in Hardin County with nearby schools including Elizabethtown High School, New Beginnings Christian Academy, and Academy of Learning - Elizabethtown.
Ownership History
Date
Name
Owned For
Owner Type
Purchase Details
Closed on
Aug 9, 2024
Sold by
Fentress Properties Llc
Bought by
Johnson Brody M and Johnson Cynthia E
Current Estimated Value
Home Financials for this Owner
Home Financials are based on the most recent Mortgage that was taken out on this home.
Original Mortgage
$180,000
Outstanding Balance
$177,994
Interest Rate
6.95%
Mortgage Type
New Conventional
Estimated Equity
$51,925
Purchase Details
Closed on
May 2, 2023
Sold by
Fentress William Taylor and Fentress Candice Brooke
Bought by
Fentress Properties Llc
Purchase Details
Closed on
Aug 20, 2012
Sold by
Fentress William Bradley and Fentress Lisbeth
Bought by
The Design Group Hair Salon Llc
Create a Home Valuation Report for This Property
The Home Valuation Report is an in-depth analysis detailing your home's value as well as a comparison with similar homes in the area
Home Values in the Area
Average Home Value in this Area
Purchase History
| Date | Buyer | Sale Price | Title Company |
|---|---|---|---|
| Johnson Brody M | $220,000 | None Listed On Document | |
| Fentress Properties Llc | $135,600 | None Listed On Document | |
| Fentress William Taylor | -- | None Listed On Document | |
| Fentress William Taylor | -- | None Listed On Document | |
| The Design Group Hair Salon Llc | $115,000 | None Available |
Source: Public Records
Mortgage History
| Date | Status | Borrower | Loan Amount |
|---|---|---|---|
| Open | Johnson Brody M | $180,000 | |
| Closed | Johnson Brody M | $180,000 |
Source: Public Records
Tax History Compared to Growth
Tax History
| Year | Tax Paid | Tax Assessment Tax Assessment Total Assessment is a certain percentage of the fair market value that is determined by local assessors to be the total taxable value of land and additions on the property. | Land | Improvement |
|---|---|---|---|---|
| 2024 | $1,700 | $135,600 | $16,800 | $118,800 |
| 2023 | $1,641 | $135,600 | $16,800 | $118,800 |
| 2022 | $1,520 | $115,600 | $16,800 | $98,800 |
| 2021 | $1,479 | $115,600 | $16,800 | $98,800 |
| 2020 | $1,466 | $115,600 | $16,800 | $98,800 |
| 2019 | $133 | $115,600 | $0 | $0 |
| 2018 | $1,415 | $115,000 | $0 | $0 |
| 2017 | $1,381 | $115,000 | $0 | $0 |
| 2016 | $0 | $115,000 | $0 | $0 |
| 2015 | $1,140 | $115,000 | $0 | $0 |
| 2012 | -- | $115,000 | $0 | $0 |
Source: Public Records
Map
Nearby Homes
- 414 Sycamore St
- 116 Turtle Creek Dr
- 113 Turtle Creek Dr
- 404 Diecks Dr
- 512 N Mantle Ave
- 512 Village Dr
- 517 N Mantle Ave
- 303 N Mantle Ave
- 300 Fall Creek Ln
- 100 Cozy Ct
- 703 Freeman Lake Rd
- 710 Freeman Lake Rd
- 311 Mallory St
- 329 Robin Rd
- 717 Sunrise Ln
- 306 Hardin St
- 310 A/B Jefferson St
- 213 Chandler St
- 703 N Miles St
- 807 Lakeside Dr
- 516 Orchard Dr
- 514 Orchard Dr
- 416 Sycamore St
- 517 Spring Dr
- 521 Spring Dr
- 404 Sycamore St
- 42 Monterey Rd
- 9 Whembley Dr
- 10 Whembley Dr
- Lot 21A The Orchard
- Lot 45A The Orchard
- Lot 44 The Orchard
- Lot 43A The Orchard
- Lot 42 The Orchard
- Lot 39 The Orchard
- Lot 38 The Orchard
- Lot 37 The Orchard
- Lot 36 The Orchard
- Lot 34A The Orchard
- Lot 33 The Orchard