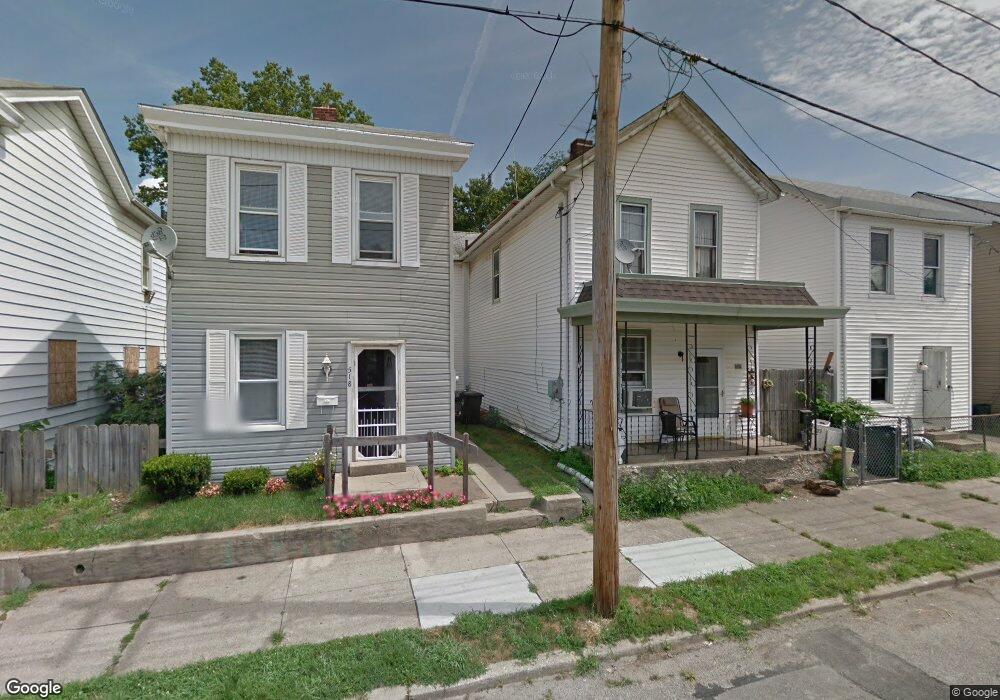
520 Vine St Hamilton, OH 45011
East Hamilton NeighborhoodEstimated Value: $56,000
3
Beds
1
Bath
1,600
Sq Ft
$35/Sq Ft
Est. Value
About This Home
This home is located at 520 Vine St, Hamilton, OH 45011 and is currently priced at $56,000, approximately $35 per square foot. 520 Vine St is a home located in Butler County with nearby schools including Fairwood Elementary School, Garfield Middle School, and Hamilton Freshman School.
Ownership History
Date
Name
Owned For
Owner Type
Purchase Details
Closed on
Jul 26, 2021
Sold by
Butler County Land Reutilization Corp
Bought by
City Of Hamilton
Current Estimated Value
Purchase Details
Closed on
Sep 20, 2018
Sold by
Burbage Charlotte
Bought by
Butler County Land Reutilization Corp
Purchase Details
Closed on
Apr 12, 2004
Sold by
Walters Rick A
Bought by
Deutsche Bank National Trust Co and Bankers Trust Co Of California Na
Create a Home Valuation Report for This Property
The Home Valuation Report is an in-depth analysis detailing your home's value as well as a comparison with similar homes in the area
Home Values in the Area
Average Home Value in this Area
Purchase History
| Date | Buyer | Sale Price | Title Company |
|---|---|---|---|
| City Of Hamilton | -- | None Available | |
| Butler County Land Reutilization Corp | -- | None Available | |
| Deutsche Bank National Trust Co | $21,250 | -- |
Source: Public Records
Mortgage History
| Date | Status | Borrower | Loan Amount |
|---|---|---|---|
| Closed | Butler County Land Reutilization Corp | $0 |
Source: Public Records
Tax History
| Year | Tax Paid | Tax Assessment Tax Assessment Total Assessment is a certain percentage of the fair market value that is determined by local assessors to be the total taxable value of land and additions on the property. | Land | Improvement |
|---|---|---|---|---|
| 2025 | $61 | $730 | $730 | -- |
| 2024 | $61 | $730 | $730 | -- |
| 2023 | $41 | $730 | $730 | -- |
| 2022 | $41 | $730 | $730 | $0 |
| 2021 | $41 | $730 | $730 | $0 |
| 2020 | $41 | $730 | $730 | $0 |
| 2019 | $53 | $730 | $730 | $0 |
| 2018 | $41 | $4,720 | $730 | $3,990 |
| 2017 | $41 | $4,720 | $730 | $3,990 |
| 2016 | $41 | $4,250 | $730 | $3,520 |
| 2015 | $63 | $4,250 | $730 | $3,520 |
| 2014 | $41 | $4,250 | $730 | $3,520 |
| 2013 | $41 | $6,170 | $1,890 | $4,280 |
Source: Public Records
Map
Nearby Homes
Your Personal Tour Guide
Ask me questions while you tour the home.