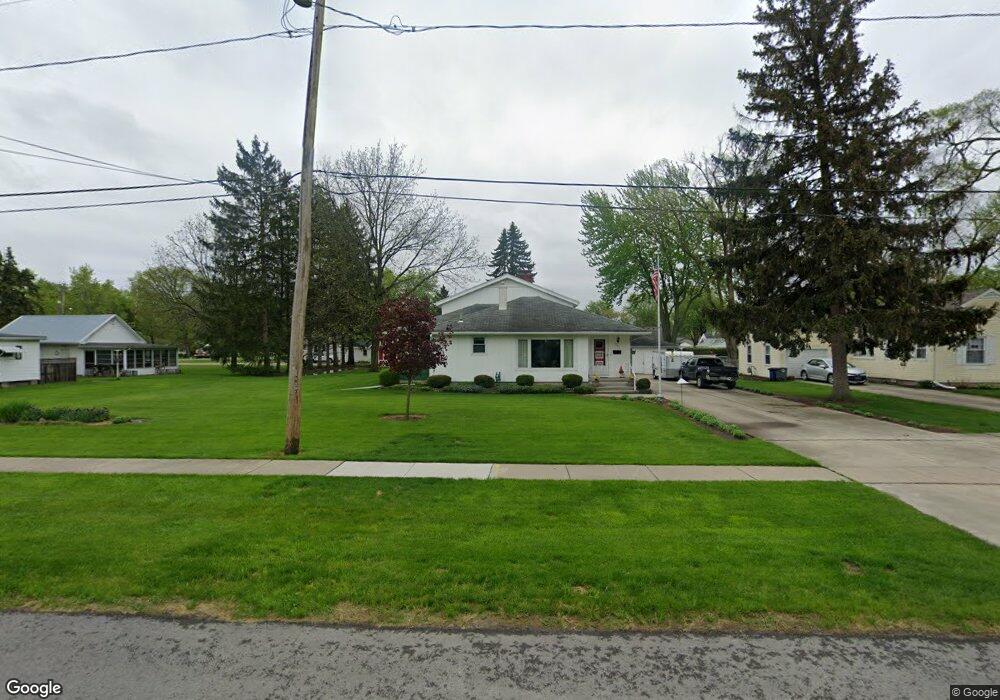
520 W 8th St Perrysburg, OH 43551
Estimated Value: $249,000 - $322,000
4
Beds
3
Baths
1,811
Sq Ft
$160/Sq Ft
Est. Value
About This Home
This home is located at 520 W 8th St, Perrysburg, OH 43551 and is currently estimated at $289,997, approximately $160 per square foot. 520 W 8th St is a home located in Wood County with nearby schools including Frank Elementary School, Perrysburg Junior High School, and Perrysburg High School.
Ownership History
Date
Name
Owned For
Owner Type
Purchase Details
Closed on
Jul 22, 2021
Sold by
West Patricia A King and The King Rresidence Trust
Bought by
Lee Jackelyn D and Lee Andrew R
Current Estimated Value
Home Financials for this Owner
Home Financials are based on the most recent Mortgage that was taken out on this home.
Original Mortgage
$160,000
Outstanding Balance
$145,242
Interest Rate
2.93%
Mortgage Type
New Conventional
Estimated Equity
$144,755
Purchase Details
Closed on
Jun 23, 2020
Sold by
King William P
Bought by
West Patricia A King and King Residence Trust
Purchase Details
Closed on
Jul 16, 2019
Sold by
King Jr William P & Catherine A Trustees
Bought by
King Jr William P Trustee
Purchase Details
Closed on
Oct 30, 2007
Sold by
King William P and King Catherine A
Bought by
King William P and King Catherine A
Purchase Details
Closed on
Jan 1, 1990
Bought by
King William P
Create a Home Valuation Report for This Property
The Home Valuation Report is an in-depth analysis detailing your home's value as well as a comparison with similar homes in the area
Home Values in the Area
Average Home Value in this Area
Purchase History
| Date | Buyer | Sale Price | Title Company |
|---|---|---|---|
| Lee Jackelyn D | $200,000 | None Available | |
| West Patricia A King | $500 | None Available | |
| King William P | $500 | None Available | |
| King Jr William P Trustee | -- | -- | |
| King William P | -- | Attorney | |
| King William P | -- | -- |
Source: Public Records
Mortgage History
| Date | Status | Borrower | Loan Amount |
|---|---|---|---|
| Open | Lee Jackelyn D | $160,000 |
Source: Public Records
Tax History Compared to Growth
Tax History
| Year | Tax Paid | Tax Assessment Tax Assessment Total Assessment is a certain percentage of the fair market value that is determined by local assessors to be the total taxable value of land and additions on the property. | Land | Improvement |
|---|---|---|---|---|
| 2024 | $3,570 | $61,705 | $4,270 | $57,435 |
| 2023 | $3,570 | $61,710 | $4,270 | $57,440 |
| 2021 | $2,551 | $49,280 | $3,710 | $45,570 |
| 2020 | $2,537 | $49,280 | $3,710 | $45,570 |
| 2019 | $2,085 | $41,060 | $3,710 | $37,350 |
| 2018 | $1,851 | $41,060 | $3,710 | $37,350 |
| 2017 | $1,839 | $41,060 | $3,710 | $37,350 |
| 2016 | $1,792 | $38,850 | $3,290 | $35,560 |
| 2015 | $1,842 | $38,850 | $3,290 | $35,560 |
| 2014 | $1,807 | $38,850 | $3,290 | $35,560 |
| 2013 | $1,850 | $38,850 | $3,290 | $35,560 |
Source: Public Records
Map
Nearby Homes
- 865 Mulberry St
- 872 Cherry St
- 204 W 8th St
- 1016 Walnut St
- 412 W South Boundary St
- 122 W 6th St
- 454 S Ridge Dr
- 505 Boody Ct
- 528 Elm St
- 208 E Indiana Ave
- 1085 Birch Dr
- 664 Little Creek Dr
- 471 Rutledge Ct
- 11966 Eckel Junction Rd
- 314 E 2nd St
- 338 E 2nd St
- 135 Birchcrest Dr
- 622 Turnbury Ln Unit 622
- 832 Turnbury Ln Unit 28
- 130 Cedar Ct