M
Landlord's Agent in 2023
My Tran
Virtual Properties Realty.com
(678) 463-5769
2 in this area
72 Total Sales
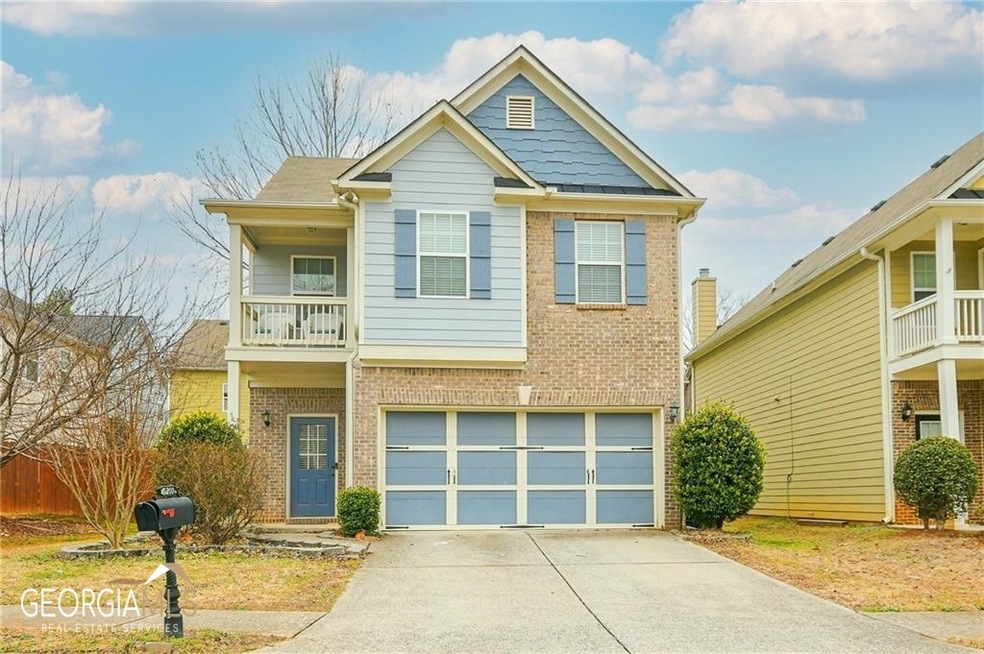
Estimated Value: $389,000 - $420,000
Ready to move in. Freshly paint, New floor, Convenience location in Buford City, best High School district. Enjoy your neighborhood amenities including pool, playground and basketball court. Convenient access to I-85, Mall of GA and all of your favorite restaurant/shops. . Open floor plan with great room/family room with cozy fireplace, good size dining area, spacious kitchen. 4 Bedroom and 2.5 bath. 2,550 square feet, two-car garage. Enjoy evening relax in quiet/private fenced backyard. Spacious suite with vaulted ceiling, walk-out balcony, dual vanities, stand up shower with separate soaking tub and walk-in closet. 3 additional good size bedroom. Credit requirement is the must with 640 + credit score.
| Date | Buyer | Sale Price | Title Company |
|---|---|---|---|
| Ltn Investment Group Llc | -- | -- | |
| Nguyen Chau | $367,000 | -- | |
| Meagher Derrick G | $230,000 | -- | |
| Maczis Justin | -- | -- | |
| Maczis Justin | $190,000 | -- | |
| Bonilla Silvana | -- | -- | |
| Imperial Homes Of Georgia Llc | -- | -- | |
| Bonilla Silvana | $184,500 | -- |
| Date | Status | Borrower | Loan Amount |
|---|---|---|---|
| Previous Owner | Meagher Derrick G | $172,500 | |
| Previous Owner | Maczis Justin | $186,774 | |
| Previous Owner | Maczis Justin | $186,558 | |
| Previous Owner | Bonilla Silvana | $193,956 | |
| Previous Owner | Imperial Homes Of Georgia Llc | $46,150 | |
| Previous Owner | Bonilla Silvana | $138,300 |
| Date | Event | Price | List to Sale | Price per Sq Ft | Prior Sale |
|---|---|---|---|---|---|
| 06/09/2023 06/09/23 | Rented | $2,500 | 0.0% | -- | |
| 05/18/2023 05/18/23 | For Rent | $2,500 | 0.0% | -- | |
| 03/28/2023 03/28/23 | Sold | $367,000 | -2.1% | $144 / Sq Ft | View Prior Sale |
| 03/16/2023 03/16/23 | Pending | -- | -- | -- | |
| 03/15/2023 03/15/23 | For Sale | $375,000 | 0.0% | $147 / Sq Ft | |
| 02/15/2023 02/15/23 | Pending | -- | -- | -- | |
| 02/13/2023 02/13/23 | Price Changed | $375,000 | -1.3% | $147 / Sq Ft | |
| 02/02/2023 02/02/23 | For Sale | $380,000 | +3.5% | $149 / Sq Ft | |
| 01/10/2023 01/10/23 | Off Market | $367,000 | -- | -- | |
| 01/10/2023 01/10/23 | For Sale | $380,000 | +3.5% | $149 / Sq Ft | |
| 12/27/2022 12/27/22 | Off Market | $367,000 | -- | -- | |
| 12/12/2022 12/12/22 | For Sale | $380,000 | +65.2% | $149 / Sq Ft | |
| 03/08/2019 03/08/19 | Sold | $230,000 | -2.1% | $106 / Sq Ft | View Prior Sale |
| 02/11/2019 02/11/19 | Pending | -- | -- | -- | |
| 01/23/2019 01/23/19 | Price Changed | $235,000 | -2.1% | $109 / Sq Ft | |
| 01/16/2019 01/16/19 | For Sale | $240,000 | +26.3% | $111 / Sq Ft | |
| 06/29/2016 06/29/16 | Sold | $190,000 | -1.0% | $75 / Sq Ft | View Prior Sale |
| 05/27/2016 05/27/16 | Pending | -- | -- | -- | |
| 04/29/2016 04/29/16 | For Sale | $192,000 | -- | $75 / Sq Ft |
| Year | Tax Paid | Tax Assessment Tax Assessment Total Assessment is a certain percentage of the fair market value that is determined by local assessors to be the total taxable value of land and additions on the property. | Land | Improvement |
|---|---|---|---|---|
| 2024 | $5,520 | $146,800 | $33,200 | $113,600 |
| 2023 | $5,520 | $170,840 | $33,200 | $137,640 |
| 2022 | $4,617 | $150,880 | $28,800 | $122,080 |
| 2021 | $3,815 | $109,200 | $20,720 | $88,480 |
| 2020 | $3,388 | $92,000 | $19,600 | $72,400 |
| 2019 | $3,153 | $97,440 | $19,600 | $77,840 |
| 2018 | $2,857 | $83,720 | $15,600 | $68,120 |
| 2016 | $2,673 | $74,280 | $14,000 | $60,280 |
| 2015 | $2,381 | $65,160 | $12,400 | $52,760 |
| 2014 | -- | $55,640 | $10,800 | $44,840 |
M
Landlord's Agent in 2023
My Tran
Virtual Properties Realty.com
(678) 463-5769
2 in this area
72 Total Sales

Seller's Agent in 2023
Colin Peebles
HomeSmart
(770) 823-2864
1 in this area
65 Total Sales
M
Seller's Agent in 2019
Mahota Real Estate Partners
Keller Williams Realty Atlanta Partners
61 Total Sales
H
Seller's Agent in 2016
Heather Wilson
NOT A VALID MEMBER
Buyer's Agent in 2016
Jennifer Mahota
Keller Williams Realty Atlanta Partners
(678) 852-8322
38 Total Sales
Source: Georgia MLS
MLS Number: 20123768
APN: 3-007-473
Disclaimer: Certain information contained herein is derived from information provided by parties other than Homes.com. All information provided is deemed reliable, but is not guaranteed to be accurate and should be independently verified.
![]() The data relating to real estate for sale on this web site comes in part from the Broker Reciprocity Program of Georgia MLS. Real estate listings held by brokerage firms other than Redfin are marked with the Broker Reciprocity logo and detailed information about them includes the name of the listing brokers. Information deemed reliable but not guaranteed. Copyright 2025 Georgia MLS. All rights reserved.
The data relating to real estate for sale on this web site comes in part from the Broker Reciprocity Program of Georgia MLS. Real estate listings held by brokerage firms other than Redfin are marked with the Broker Reciprocity logo and detailed information about them includes the name of the listing brokers. Information deemed reliable but not guaranteed. Copyright 2025 Georgia MLS. All rights reserved.