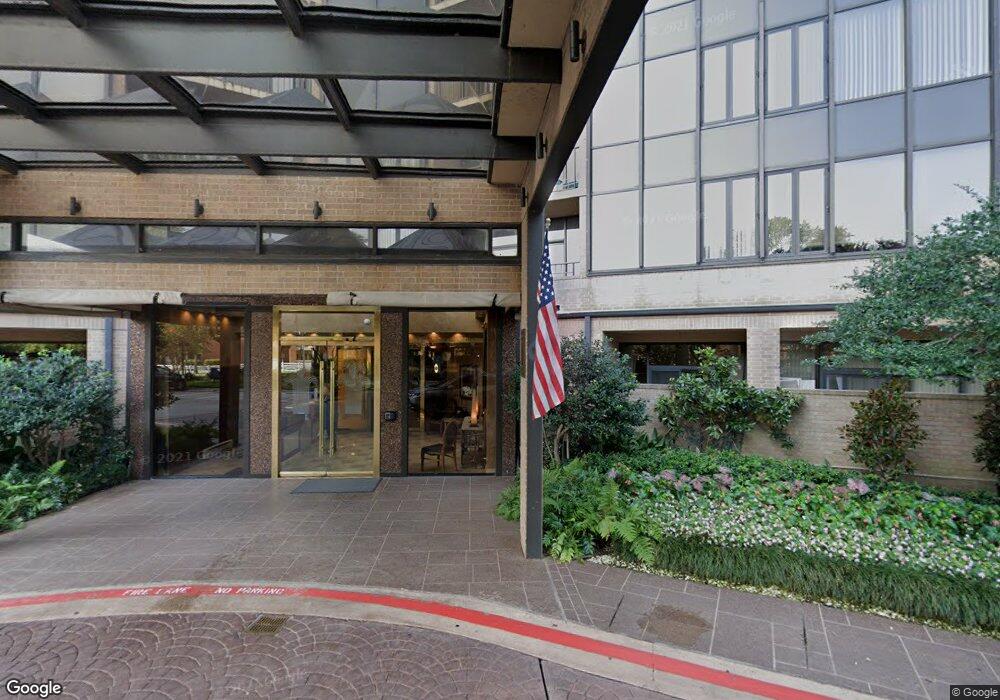
The Bonaventure 5200 Keller Springs Rd Unit 422-24 Dallas, TX 75248
North Dallas NeighborhoodEstimated Value: $405,000 - $460,000
4
Beds
4
Baths
3,691
Sq Ft
$116/Sq Ft
Est. Value
About This Home
This home is located at 5200 Keller Springs Rd Unit 422-24, Dallas, TX 75248 and is currently estimated at $429,500, approximately $116 per square foot. 5200 Keller Springs Rd Unit 422-24 is a home located in Dallas County with nearby schools including George Herbert Walker Bush Elementary School, E.D. Walker Middle School, and W T White High School.
Ownership History
Date
Name
Owned For
Owner Type
Purchase Details
Closed on
Apr 3, 2019
Sold by
Clay Freed Properties Llc
Bought by
Raphael Arthur and Raphael Gail
Current Estimated Value
Home Financials for this Owner
Home Financials are based on the most recent Mortgage that was taken out on this home.
Original Mortgage
$375,000
Outstanding Balance
$329,692
Interest Rate
4.3%
Mortgage Type
Purchase Money Mortgage
Estimated Equity
$99,808
Purchase Details
Closed on
Apr 15, 2010
Sold by
Polakoff Richard A and Polakoff Roslyn
Bought by
Polakoff Richard A and Polakoff Roslyn
Purchase Details
Closed on
Dec 14, 2005
Sold by
Kim Jeong Nim
Bought by
Polakoff Richard and Polakoff Roslyn
Purchase Details
Closed on
Dec 12, 2005
Sold by
Kim In Kom
Bought by
Kim Jeong Nim
Create a Home Valuation Report for This Property
The Home Valuation Report is an in-depth analysis detailing your home's value as well as a comparison with similar homes in the area
Home Values in the Area
Average Home Value in this Area
Purchase History
| Date | Buyer | Sale Price | Title Company |
|---|---|---|---|
| Raphael Arthur | -- | None Available | |
| Polakoff Richard A | -- | None Available | |
| Polakoff Richard | -- | -- | |
| Kim Jeong Nim | -- | Blue Star Title |
Source: Public Records
Mortgage History
| Date | Status | Borrower | Loan Amount |
|---|---|---|---|
| Open | Raphael Arthur | $375,000 |
Source: Public Records
Tax History Compared to Growth
Tax History
| Year | Tax Paid | Tax Assessment Tax Assessment Total Assessment is a certain percentage of the fair market value that is determined by local assessors to be the total taxable value of land and additions on the property. | Land | Improvement |
|---|---|---|---|---|
| 2025 | $2,237 | $375,720 | $19,150 | $356,570 |
| 2024 | $2,237 | $410,970 | $19,150 | $391,820 |
| 2023 | $2,237 | $365,630 | $19,150 | $346,480 |
| 2022 | $9,142 | $365,630 | $19,150 | $346,480 |
| 2021 | $9,892 | $375,000 | $19,150 | $355,850 |
| 2020 | $10,173 | $375,000 | $19,150 | $355,850 |
| 2019 | $17,853 | $627,470 | $35,220 | $592,250 |
| 2018 | $17,062 | $627,470 | $35,220 | $592,250 |
| 2017 | $14,052 | $516,740 | $21,150 | $495,590 |
| 2016 | $13,550 | $498,290 | $21,150 | $477,140 |
| 2015 | $5,890 | $479,830 | $21,150 | $458,680 |
| 2014 | $5,890 | $461,380 | $21,150 | $440,230 |
Source: Public Records
About The Bonaventure
Map
Nearby Homes
- 5200 Keller Springs Rd Unit 736
- 5200 Keller Springs Rd Unit 1424 & 1426
- 5200 Keller Springs Rd Unit 1315
- 5200 Keller Springs Rd Unit 815
- 5200 Keller Springs Rd Unit 1125
- 5200 Keller Springs Rd Unit 632
- 5200 Keller Springs Rd Unit 330
- 5200 Keller Springs Rd Unit 711
- 5200 Keller Springs Rd Unit 313
- 5200 Keller Springs Rd Unit 820
- 5200 Keller Springs Rd Unit 110
- 5200 Keller Springs Rd Unit 824
- 5200 Keller Springs Rd Unit 821
- 5200 Keller Springs Rd Unit 535
- 5200 Keller Springs Rd Unit 1322
- 5200 Keller Springs Rd Unit 317
- 5300 Keller Springs Rd Unit 2062
- 5300 Keller Springs Rd Unit 1090
- 5300 Keller Springs Rd Unit 1027
- 5325 Bent Tree Forest Dr Unit 1104
- 5200 Keller Springs Rd Unit 927
- 5200 Keller Springs Rd Unit 1432
- 5200 Keller Springs Rd Unit 1215
- 5200 Keller Springs Rd Unit 212
- 5200 Keller Springs Rd Unit 914
- 5200 Keller Springs Rd Unit 430
- 5200 Keller Springs Rd Unit 930
- 5200 Keller Springs Rd Unit 831
- 5200 Keller Springs Rd Unit 633
- 5200 Keller Springs Rd Unit 621
- 5200 Keller Springs Rd Unit 617
- 5200 Keller Springs Rd Unit 520
- 5200 Keller Springs Rd Unit 230
- 5200 Keller Springs Rd Unit 611
- 5200 Keller Springs Rd Unit 810
- 5200 Keller Springs Rd Unit 334
- 5200 Keller Springs Rd Unit 512
- 5200 Keller Springs Rd Unit 813
- 5200 Keller Springs Rd Unit 825
- 5200 Keller Springs Rd Unit 936