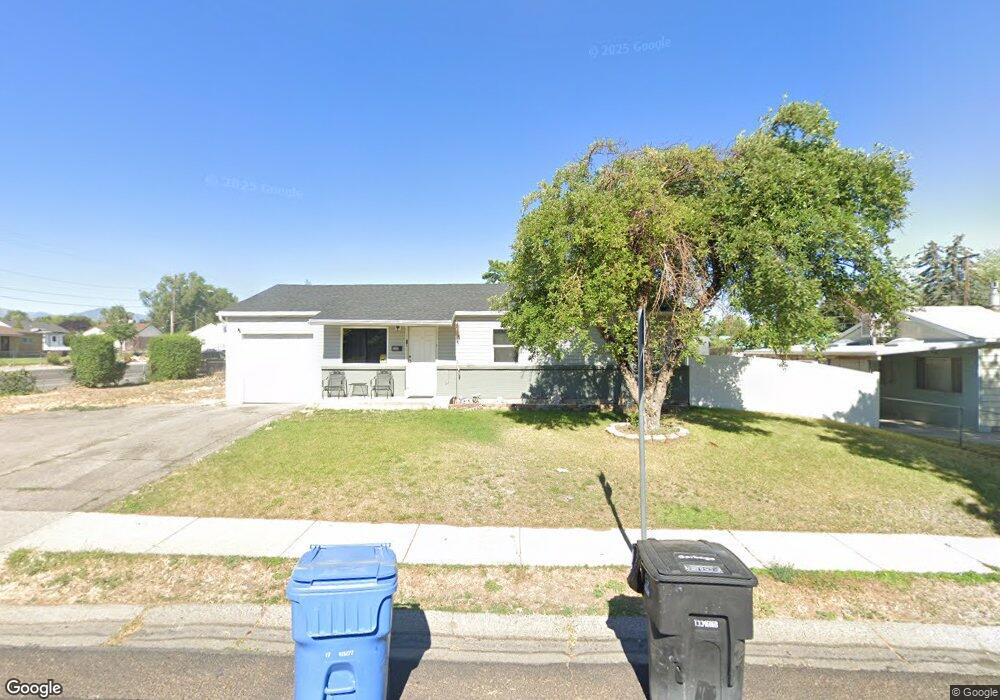
5200 Steele St Salt Lake City, UT 84118
Estimated Value: $358,000 - $409,690
4
Beds
2
Baths
988
Sq Ft
$397/Sq Ft
Est. Value
About This Home
This home is located at 5200 Steele St, Salt Lake City, UT 84118 and is currently estimated at $392,173, approximately $396 per square foot. 5200 Steele St is a home located in Salt Lake County with nearby schools including David Gourley Elementary School, Kearns Jr High School, and Kearns High School.
Ownership History
Date
Name
Owned For
Owner Type
Purchase Details
Closed on
Nov 6, 2017
Sold by
M & M Properties Llc
Bought by
Allen Stephanie
Current Estimated Value
Home Financials for this Owner
Home Financials are based on the most recent Mortgage that was taken out on this home.
Original Mortgage
$212,480
Outstanding Balance
$177,954
Interest Rate
3.83%
Mortgage Type
FHA
Estimated Equity
$214,219
Purchase Details
Closed on
Apr 19, 2017
Sold by
Hinckley Lynn F
Bought by
M & M Properties Llc
Purchase Details
Closed on
Apr 21, 2015
Sold by
M & M Properties Llc
Bought by
Meridan Title Company and Michel Investments Llc
Create a Home Valuation Report for This Property
The Home Valuation Report is an in-depth analysis detailing your home's value as well as a comparison with similar homes in the area
Home Values in the Area
Average Home Value in this Area
Purchase History
| Date | Buyer | Sale Price | Title Company |
|---|---|---|---|
| Allen Stephanie | -- | Meridian Title | |
| M & M Properties Llc | -- | Meridian Title | |
| Meridan Title Company | -- | None Available |
Source: Public Records
Mortgage History
| Date | Status | Borrower | Loan Amount |
|---|---|---|---|
| Open | Allen Stephanie | $212,480 |
Source: Public Records
Tax History Compared to Growth
Tax History
| Year | Tax Paid | Tax Assessment Tax Assessment Total Assessment is a certain percentage of the fair market value that is determined by local assessors to be the total taxable value of land and additions on the property. | Land | Improvement |
|---|---|---|---|---|
| 2025 | $2,660 | $381,500 | $76,100 | $305,400 |
| 2024 | $2,660 | $358,100 | $71,500 | $286,600 |
| 2023 | $2,448 | $316,600 | $68,700 | $247,900 |
| 2022 | $2,485 | $330,000 | $67,400 | $262,600 |
| 2021 | $2,250 | $270,500 | $51,900 | $218,600 |
| 2020 | $2,108 | $224,400 | $47,300 | $177,100 |
| 2019 | $1,983 | $220,400 | $44,600 | $175,800 |
| 2018 | $1,874 | $201,000 | $44,600 | $156,400 |
| 2017 | $1,338 | $150,200 | $44,600 | $105,600 |
| 2016 | $1,125 | $126,600 | $41,100 | $85,500 |
| 2015 | $1,020 | $106,800 | $52,800 | $54,000 |
| 2014 | $126 | $97,700 | $49,000 | $48,700 |
Source: Public Records
Map
Nearby Homes