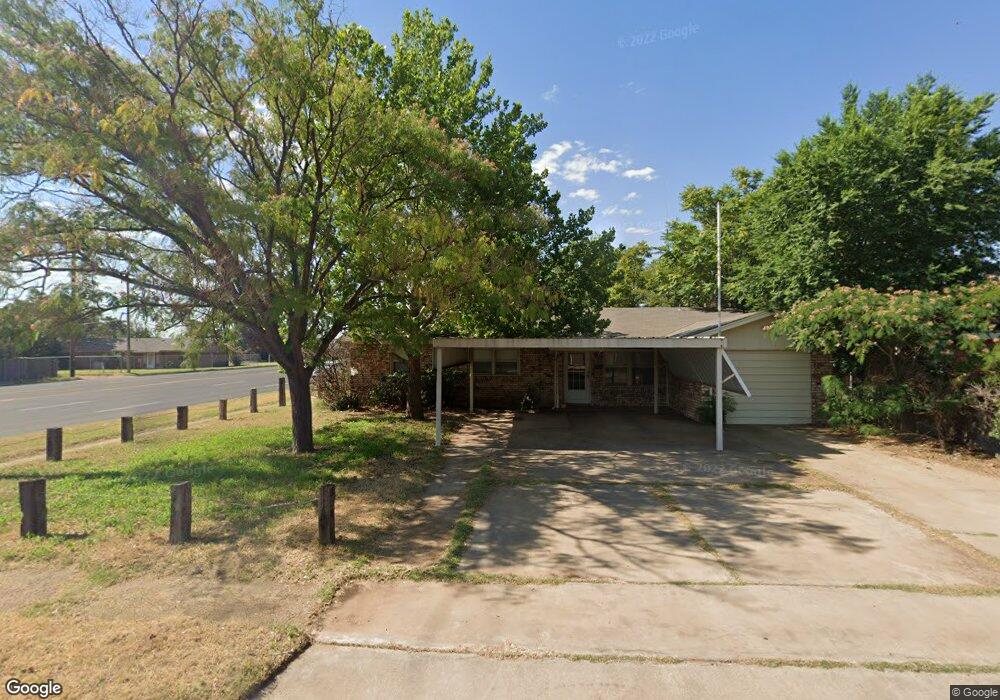
5201 47th St Lubbock, TX 79414
Wester NeighborhoodEstimated Value: $158,000 - $168,000
3
Beds
2
Baths
1,516
Sq Ft
$108/Sq Ft
Est. Value
About This Home
This home is located at 5201 47th St, Lubbock, TX 79414 and is currently estimated at $163,968, approximately $108 per square foot. 5201 47th St is a home located in Lubbock County with nearby schools including Wester Elementary School, Commander William C. McCool Academy, and Irons Middle School.
Ownership History
Date
Name
Owned For
Owner Type
Purchase Details
Closed on
Jan 21, 2016
Sold by
Thompson Robert
Bought by
Thompson Brian
Current Estimated Value
Purchase Details
Closed on
Jul 16, 2013
Sold by
Thompson Carolyn Elaine
Bought by
Thompson Brian and Thompson Robert
Purchase Details
Closed on
Nov 30, 2009
Sold by
Scarber Wayne Alan
Bought by
Thompson Carolyn Elaine
Purchase Details
Closed on
Nov 9, 2004
Sold by
Scarber Gracie Christene Estate
Bought by
Thompson Brian and Thompson Robert
Create a Home Valuation Report for This Property
The Home Valuation Report is an in-depth analysis detailing your home's value as well as a comparison with similar homes in the area
Home Values in the Area
Average Home Value in this Area
Purchase History
| Date | Buyer | Sale Price | Title Company |
|---|---|---|---|
| Thompson Brian | -- | None Available | |
| Thompson Brian | -- | -- | |
| Thompson Carolyn Elaine | -- | None Available | |
| Thompson Brian | -- | -- |
Source: Public Records
Tax History Compared to Growth
Tax History
| Year | Tax Paid | Tax Assessment Tax Assessment Total Assessment is a certain percentage of the fair market value that is determined by local assessors to be the total taxable value of land and additions on the property. | Land | Improvement |
|---|---|---|---|---|
| 2025 | $2,947 | $164,859 | $27,000 | $137,859 |
| 2024 | $2,947 | $162,306 | $27,000 | $135,306 |
| 2023 | $3,125 | $168,138 | $9,855 | $158,283 |
| 2022 | $2,783 | $137,502 | $9,855 | $127,647 |
| 2021 | $2,541 | $118,626 | $9,855 | $108,771 |
| 2020 | $2,419 | $111,226 | $9,855 | $101,371 |
| 2019 | $2,414 | $107,527 | $9,855 | $97,672 |
| 2018 | $2,351 | $104,567 | $9,855 | $94,712 |
| 2017 | $2,137 | $94,948 | $9,855 | $85,093 |
| 2016 | $2,104 | $93,468 | $9,855 | $83,613 |
| 2015 | $1,786 | $86,766 | $6,570 | $80,196 |
| 2014 | $1,786 | $80,327 | $6,570 | $73,757 |
Source: Public Records
Map
Nearby Homes