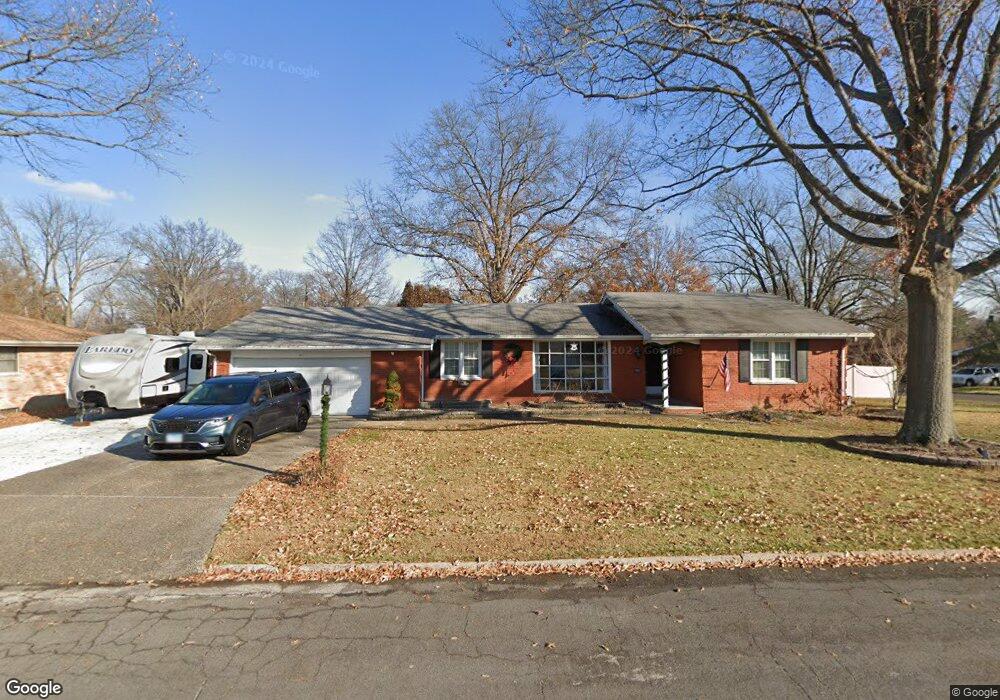
5201 Jerome Dr Godfrey, IL 62035
Estimated Value: $183,000 - $268,000
4
Beds
2
Baths
1,402
Sq Ft
$158/Sq Ft
Est. Value
About This Home
This home is located at 5201 Jerome Dr, Godfrey, IL 62035 and is currently estimated at $222,144, approximately $158 per square foot. 5201 Jerome Dr is a home located in Madison County with nearby schools including Gilson Brown Elementary School, Alton Middle School, and Alton High School.
Ownership History
Date
Name
Owned For
Owner Type
Purchase Details
Closed on
Aug 31, 2016
Sold by
Estes Robert J and Estes Mary B
Bought by
Kestler Aaron E and Bonnell Danielle L
Current Estimated Value
Home Financials for this Owner
Home Financials are based on the most recent Mortgage that was taken out on this home.
Original Mortgage
$154,156
Outstanding Balance
$122,617
Interest Rate
3.3%
Mortgage Type
FHA
Estimated Equity
$99,527
Purchase Details
Closed on
Jul 19, 2016
Sold by
Mcculley Robert L and Mcculley Joan L
Bought by
Estes Robert J and Estes Mary B
Home Financials for this Owner
Home Financials are based on the most recent Mortgage that was taken out on this home.
Original Mortgage
$154,156
Outstanding Balance
$122,617
Interest Rate
3.3%
Mortgage Type
FHA
Estimated Equity
$99,527
Purchase Details
Closed on
Mar 18, 2016
Sold by
Mcculley Robert L and Mcculley Joan L
Bought by
Estes Robert J and Estes Mary B
Create a Home Valuation Report for This Property
The Home Valuation Report is an in-depth analysis detailing your home's value as well as a comparison with similar homes in the area
Home Values in the Area
Average Home Value in this Area
Purchase History
| Date | Buyer | Sale Price | Title Company |
|---|---|---|---|
| Kestler Aaron E | $157,000 | Community Title | |
| Estes Robert J | -- | Community Title | |
| Estes Robert J | $90,000 | Community Title & Escrow |
Source: Public Records
Mortgage History
| Date | Status | Borrower | Loan Amount |
|---|---|---|---|
| Open | Kestler Aaron E | $154,156 |
Source: Public Records
Tax History Compared to Growth
Tax History
| Year | Tax Paid | Tax Assessment Tax Assessment Total Assessment is a certain percentage of the fair market value that is determined by local assessors to be the total taxable value of land and additions on the property. | Land | Improvement |
|---|---|---|---|---|
| 2024 | $3,794 | $62,270 | $13,350 | $48,920 |
| 2023 | $3,794 | $57,480 | $12,320 | $45,160 |
| 2022 | $3,591 | $52,570 | $11,270 | $41,300 |
| 2021 | $3,234 | $49,440 | $10,600 | $38,840 |
| 2020 | $3,167 | $48,370 | $10,370 | $38,000 |
| 2019 | $3,233 | $47,110 | $10,100 | $37,010 |
| 2018 | $3,178 | $45,100 | $9,670 | $35,430 |
| 2017 | $2,640 | $45,100 | $9,670 | $35,430 |
| 2016 | $2,565 | $45,100 | $9,670 | $35,430 |
| 2015 | $2,284 | $43,680 | $9,370 | $34,310 |
| 2014 | $2,284 | $43,680 | $9,370 | $34,310 |
| 2013 | $2,284 | $43,680 | $9,370 | $34,310 |
Source: Public Records
Map
Nearby Homes
- 5200 Little Creek Ln
- 1900 Cheyenne Dr
- 4516 Levis Ln
- 4407 Bluffdale Ct
- 5221 Sundrop Ct
- 4624 Valleydale Rd
- 1717 Aster Ln
- 4618 Levis Ln
- 1502 Autumn St
- 1713 Aster Ln
- 5404 Woodland Meadows Dr
- 5402 Woodland Meadows Dr
- 3100 Illini Trail
- 1403 Ryan Dr
- 1400 Ryan Dr
- 3106 Indian Trail
- 1504 Paris Dr
- 1300 White Oak Trail
- 0 Mcadams Pkwy Unit MAR25006499
- 4918 Chateau Dr
- 5203 Jerome Dr
- 2204 Oakview Dr
- 5200 Jerome Dr
- 5202 Jerome Dr
- 5205 Jerome Dr
- 5118 Jerome Dr
- 5115 Jerome Dr
- 2207 Oakview Dr
- 5204 Jerome Dr
- 2202 Oakview Dr
- 5116 Jerome Dr
- 2205 Oakview Dr
- 5207 Jerome Dr
- 5206 Jerome Dr
- 5204 Dixon Dr
- 5113 Jerome Dr
- 2203 Oakview Dr
- 2200 Oakview Dr
- 5114 Jerome Dr
- 5206 Dixon Dr