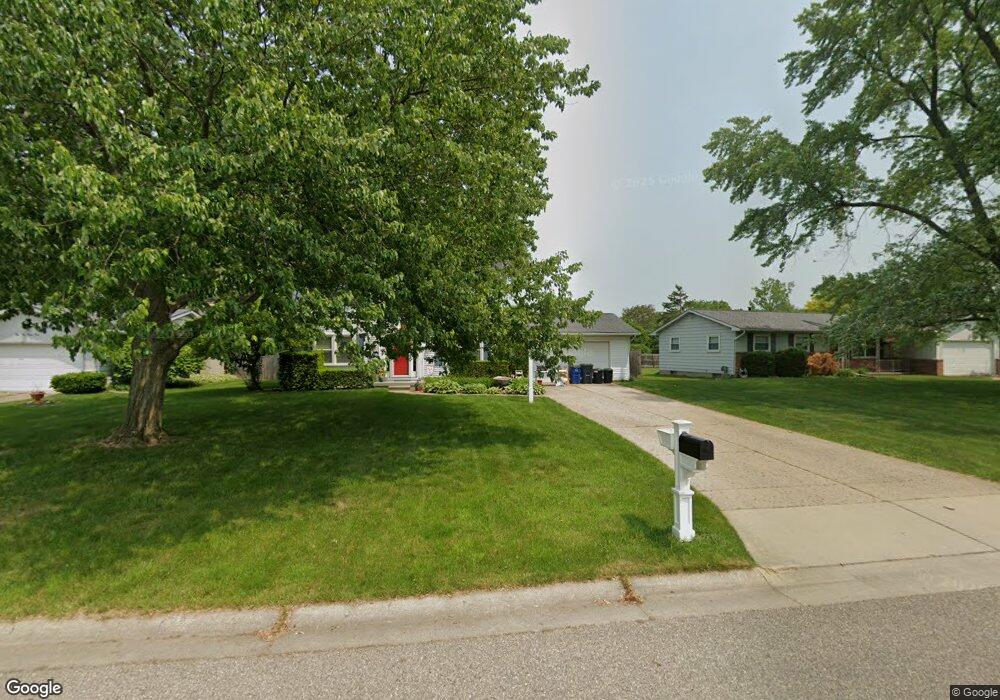
5201 N Georgetown Rd Grand Blanc, MI 48439
Estimated Value: $229,860 - $269,000
4
Beds
2
Baths
1,536
Sq Ft
$166/Sq Ft
Est. Value
About This Home
This home is located at 5201 N Georgetown Rd, Grand Blanc, MI 48439 and is currently estimated at $255,465, approximately $166 per square foot. 5201 N Georgetown Rd is a home located in Genesee County with nearby schools including Myers Elementary School, Grand Blanc East Middle School, and Grand Blanc High School.
Ownership History
Date
Name
Owned For
Owner Type
Purchase Details
Closed on
Sep 9, 2016
Sold by
Rosebrough Louis J and Rosebrough Nicole
Bought by
Rosebrough Nicole and Rosebrough Louis J
Current Estimated Value
Home Financials for this Owner
Home Financials are based on the most recent Mortgage that was taken out on this home.
Original Mortgage
$100,450
Outstanding Balance
$46,446
Interest Rate
3.43%
Mortgage Type
New Conventional
Estimated Equity
$209,019
Purchase Details
Closed on
Aug 8, 2008
Sold by
Rbs Citizens Na
Bought by
Rosebrough Louis J and Brown William A
Purchase Details
Closed on
Feb 6, 2008
Sold by
Hazlewood Roger D
Bought by
Rbs Citizens Na
Purchase Details
Closed on
Sep 4, 2003
Sold by
Hazlewood Shelly K and Hazlewood Shelly
Bought by
Hazlewood Roger D and Hazlewood Roger
Purchase Details
Closed on
Apr 14, 2000
Sold by
Guith Mark G and Guith Bonnie
Bought by
Hazlewood Roger and Hazlewood Shelly
Create a Home Valuation Report for This Property
The Home Valuation Report is an in-depth analysis detailing your home's value as well as a comparison with similar homes in the area
Home Values in the Area
Average Home Value in this Area
Purchase History
| Date | Buyer | Sale Price | Title Company |
|---|---|---|---|
| Rosebrough Nicole | -- | Title Source Inc | |
| Rosebrough Louis J | $110,000 | Guaranty Title Company | |
| Rbs Citizens Na | $126,000 | None Available | |
| Hazlewood Roger D | -- | Sargents Title Company | |
| Hazlewood Roger | $135,000 | Metropolitan Title Company |
Source: Public Records
Mortgage History
| Date | Status | Borrower | Loan Amount |
|---|---|---|---|
| Open | Rosebrough Nicole | $100,450 |
Source: Public Records
Tax History Compared to Growth
Tax History
| Year | Tax Paid | Tax Assessment Tax Assessment Total Assessment is a certain percentage of the fair market value that is determined by local assessors to be the total taxable value of land and additions on the property. | Land | Improvement |
|---|---|---|---|---|
| 2025 | $3,091 | $103,400 | $0 | $0 |
| 2024 | $1,404 | $85,700 | $0 | $0 |
| 2023 | $1,339 | $74,400 | $0 | $0 |
| 2022 | $2,743 | $61,900 | $0 | $0 |
| 2021 | $2,642 | $67,700 | $0 | $0 |
| 2020 | $1,235 | $63,300 | $0 | $0 |
| 2019 | $1,217 | $59,000 | $0 | $0 |
| 2018 | $2,506 | $59,000 | $0 | $0 |
| 2017 | $2,407 | $57,500 | $0 | $0 |
| 2016 | $2,391 | $53,600 | $0 | $0 |
| 2015 | $2,295 | $51,100 | $0 | $0 |
| 2012 | -- | $42,500 | $42,500 | $0 |
Source: Public Records
Map
Nearby Homes
- 5236 Old Franklin Rd
- 5136 Old Franklin Rd
- 5417 S Genesee Rd
- 5349 Old Franklin Rd
- 5440 S Genesee Rd
- 33 Forest Gate Ct
- 6062 Belmont Ct Unit 44
- 6101 Steeplechase Dr Unit 26
- 4428 American Heritage Rd
- 0 Daniel Dr
- 6048 Pine Cone Dr Unit 31
- 5229 Regimental Banner Dr
- TBD Forest Gate Ct
- Lot 21 Forest Gate Ct
- 00 Forest Gate Ct
- 5462 Chatham Ln
- 5278 E Maple Ave
- 00 Golden Gate Ct
- 1217 Kings Carriage Rd
- 1183 Kings Carriage Rd
- 5193 N Georgetown Rd
- 5185 N Georgetown Rd
- 5177 N Georgetown Rd
- 5211 N Georgetown Rd
- 5192 N Georgetown Rd
- 5196 N Georgetown Rd
- 5215 Old Franklin Rd
- 5204 N Georgetown Rd
- 5169 N Georgetown Rd
- 5184 N Georgetown Rd
- 5183 Old Franklin Rd
- 5231 Old Franklin Rd
- 5239 Old Haverhill Ct
- 5240 Old Haverhill Ct
- 5168 N Georgetown Rd
- 5161 N Georgetown Rd
- 5115 Old Franklin Rd
- 5139 Old Franklin Rd
- 5237 Old Franklin Rd
- 5202 Old Franklin Rd