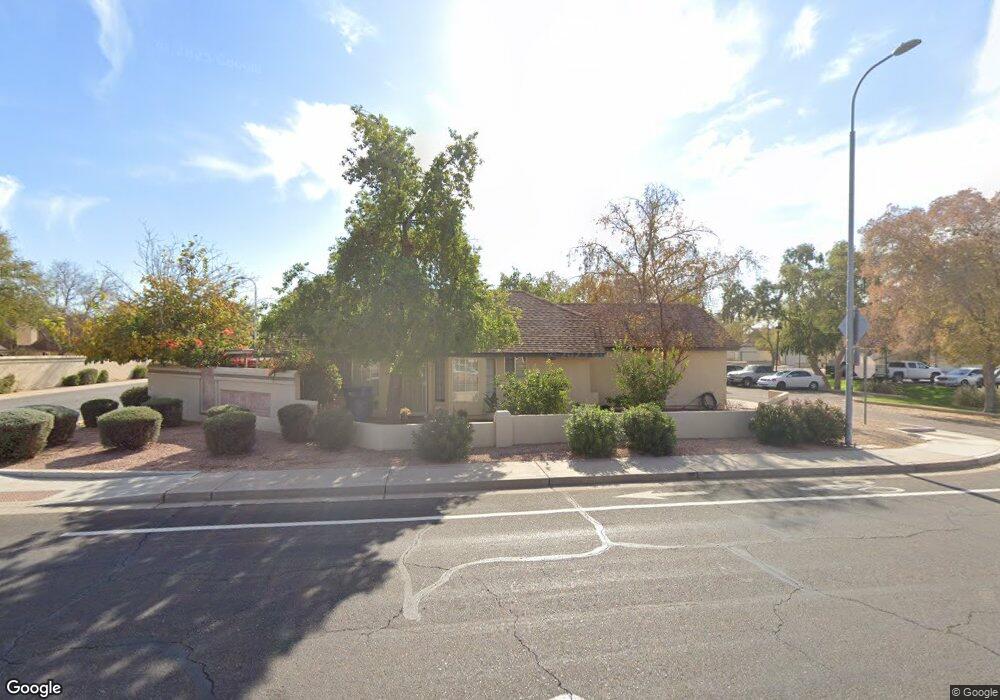
5201 W Boston Way N Chandler, AZ 85226
West Chandler NeighborhoodEstimated Value: $335,320 - $397,000
--
Bed
2
Baths
912
Sq Ft
$400/Sq Ft
Est. Value
About This Home
This home is located at 5201 W Boston Way N, Chandler, AZ 85226 and is currently estimated at $364,830, approximately $400 per square foot. 5201 W Boston Way N is a home located in Maricopa County with nearby schools including Kyrene de la Paloma School, Kyrene del Pueblo Middle School, and Corona Del Sol High School.
Ownership History
Date
Name
Owned For
Owner Type
Purchase Details
Closed on
Dec 9, 1997
Sold by
Grenke William Philip and Grenke Tamara L
Bought by
Chavez Jesus M and Chavez Josefine
Current Estimated Value
Home Financials for this Owner
Home Financials are based on the most recent Mortgage that was taken out on this home.
Original Mortgage
$40,000
Outstanding Balance
$6,767
Interest Rate
7.23%
Mortgage Type
New Conventional
Estimated Equity
$358,063
Purchase Details
Closed on
Nov 5, 1996
Sold by
Czepowski Raymond S and Czepowski Ruth
Bought by
Czepowski John and Czepowski Patricia
Purchase Details
Closed on
Mar 9, 1995
Sold by
Dowdle Tracy L
Bought by
Grenke William Philip and Hammond Tamara L
Home Financials for this Owner
Home Financials are based on the most recent Mortgage that was taken out on this home.
Original Mortgage
$77,607
Interest Rate
8.9%
Mortgage Type
FHA
Create a Home Valuation Report for This Property
The Home Valuation Report is an in-depth analysis detailing your home's value as well as a comparison with similar homes in the area
Home Values in the Area
Average Home Value in this Area
Purchase History
| Date | Buyer | Sale Price | Title Company |
|---|---|---|---|
| Chavez Jesus M | $87,000 | Fidelity Title | |
| Czepowski John | -- | -- | |
| Grenke William Philip | $78,000 | Transamerica Title Ins Co |
Source: Public Records
Mortgage History
| Date | Status | Borrower | Loan Amount |
|---|---|---|---|
| Open | Chavez Jesus M | $40,000 | |
| Previous Owner | Grenke William Philip | $77,607 |
Source: Public Records
Tax History Compared to Growth
Tax History
| Year | Tax Paid | Tax Assessment Tax Assessment Total Assessment is a certain percentage of the fair market value that is determined by local assessors to be the total taxable value of land and additions on the property. | Land | Improvement |
|---|---|---|---|---|
| 2025 | $1,199 | $15,051 | -- | -- |
| 2024 | $1,147 | $14,334 | -- | -- |
| 2023 | $1,147 | $27,400 | $5,480 | $21,920 |
| 2022 | $1,092 | $20,170 | $4,030 | $16,140 |
| 2021 | $1,151 | $18,960 | $3,790 | $15,170 |
| 2020 | $1,125 | $16,570 | $3,310 | $13,260 |
| 2019 | $1,092 | $14,850 | $2,970 | $11,880 |
| 2018 | $1,056 | $13,550 | $2,710 | $10,840 |
| 2017 | $1,006 | $12,470 | $2,490 | $9,980 |
| 2016 | $1,027 | $11,580 | $2,310 | $9,270 |
| 2015 | $948 | $11,220 | $2,240 | $8,980 |
Source: Public Records
Map
Nearby Homes
- 5143 W Mercury Way
- 5233 W Jupiter Way N
- 5137 W Jupiter Way
- 5455 W Buffalo St
- 5341 W Chicago St
- 4918 W Chicago St
- 295 N Rural Rd Unit 202
- 4624 W Chicago St
- 4612 W Jupiter Way
- 5749 W Jupiter Way
- 4611 W Butler Dr
- 5043 W Whitten St
- 4613 W Chicago St Unit 2
- 4601 W Flint St
- 5361 W Saragosa St
- 300 N Gila Springs Blvd Unit 144
- 4554 W Detroit St
- 5665 W Galveston St Unit 76
- 641 S Fir St
- 5580 W Kesler St
- 5205 W Boston Way N Unit Look>>
- 5205 W Boston Way N
- 5209 W Boston Way N
- 5213 W Boston Way N
- 5150 W Mercury Way
- 5146 W Mercury Way
- 5217 W Boston Way N
- 5158 W Mercury Way
- 5257 W Boston Way N
- 5202 W Boston Way N
- 5225 W Boston Way N
- 5206 W Boston Way N
- 5221 W Boston Way N
- 5154 W Mercury Way
- 5210 W Boston Way N
- 5226 W Boston Way N
- 50 N Bradley Dr
- 5214 W Boston Way N
- 5142 W Mercury Way
- 60 N Bradley Dr