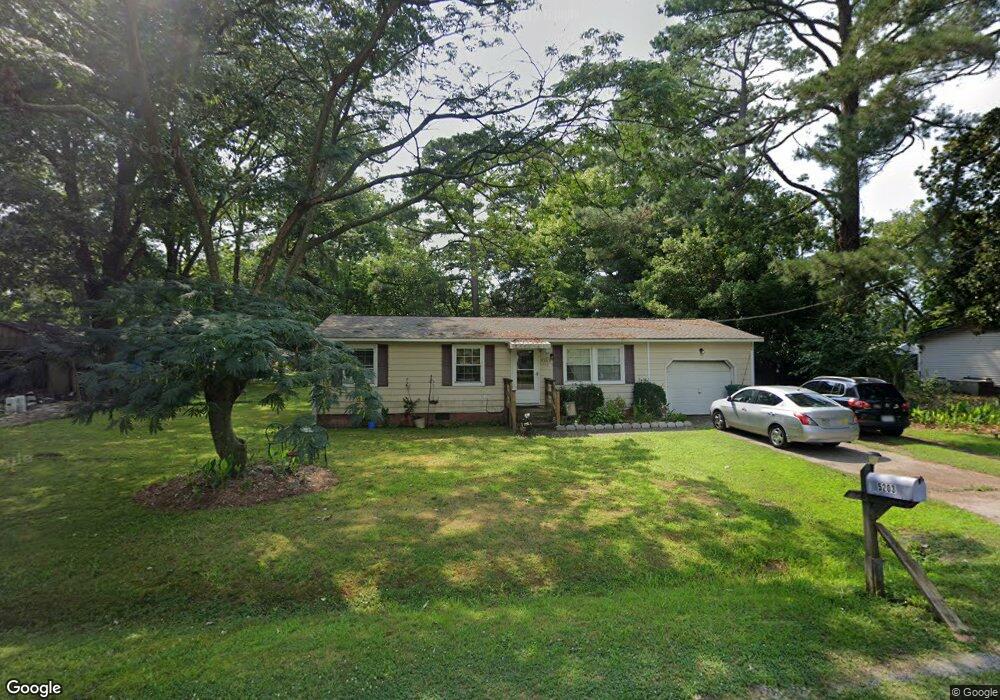
5203 Ellen St Suffolk, VA 23435
Nansemond NeighborhoodEstimated Value: $210,000 - $268,000
Studio
--
Bath
912
Sq Ft
$265/Sq Ft
Est. Value
About This Home
This home is located at 5203 Ellen St, Suffolk, VA 23435 and is currently estimated at $241,233, approximately $264 per square foot. 5203 Ellen St is a home located in Suffolk City with nearby schools including Northern Shores Elementary School, John Yeates Middle School, and Nansemond River High School.
Ownership History
Date
Name
Owned For
Owner Type
Purchase Details
Closed on
Feb 1, 2017
Sold by
Martin John J and Martin Ruth M
Bought by
Brandriff Art and Brandriff Anne
Current Estimated Value
Home Financials for this Owner
Home Financials are based on the most recent Mortgage that was taken out on this home.
Original Mortgage
$110,000
Outstanding Balance
$90,416
Interest Rate
4.2%
Mortgage Type
Seller Take Back
Estimated Equity
$150,817
Create a Home Valuation Report for This Property
The Home Valuation Report is an in-depth analysis detailing your home's value as well as a comparison with similar homes in the area
Home Values in the Area
Average Home Value in this Area
Purchase History
| Date | Buyer | Sale Price | Title Company |
|---|---|---|---|
| Brandriff Art | $110,000 | Attorney |
Source: Public Records
Mortgage History
| Date | Status | Borrower | Loan Amount |
|---|---|---|---|
| Open | Brandriff Art | $110,000 |
Source: Public Records
Tax History
| Year | Tax Paid | Tax Assessment Tax Assessment Total Assessment is a certain percentage of the fair market value that is determined by local assessors to be the total taxable value of land and additions on the property. | Land | Improvement |
|---|---|---|---|---|
| 2025 | $2,529 | $194,300 | $73,400 | $120,900 |
| 2024 | $2,529 | $189,300 | $73,400 | $115,900 |
| 2023 | $2,419 | $168,600 | $73,400 | $95,200 |
| 2022 | $1,662 | $152,500 | $73,400 | $79,100 |
| 2021 | $1,616 | $145,600 | $73,400 | $72,200 |
| 2020 | $1,626 | $146,500 | $73,400 | $73,100 |
| 2019 | $1,626 | $146,500 | $73,400 | $73,100 |
| 2018 | $1,630 | $143,500 | $73,400 | $70,100 |
| 2017 | $1,535 | $143,500 | $73,400 | $70,100 |
| 2016 | $1,504 | $140,600 | $73,400 | $67,200 |
| 2015 | $770 | $130,600 | $63,400 | $67,200 |
| 2014 | $770 | $130,600 | $63,400 | $67,200 |
Source: Public Records
Map
Nearby Homes
- 5109 Hoffler St
- 5043 Bay Cir
- 4913 Marina Dr
- 6322 Townsend Place
- 6750 Burbage Landing Cir
- 6801 Ivanhoe Ct
- 6303 Oaken Gate Dr S
- 6419 Olde Bullocks Cir
- 6210 Glenrose Dr
- 1132 Samuel Greene Way
- 1129 Marston St
- 6404 Pelican Crescent N
- 1212 Gunboat Dr
- 1211 Worden Way
- 1207 Worden Way
- 6322 Pelican Crescent S
- 4503 Twin Pines Rd
- 1018 Ashworth Way
- 2010 Ashworth Way
- 2006 Ashworth Way
Your Personal Tour Guide
Ask me questions while you tour the home.