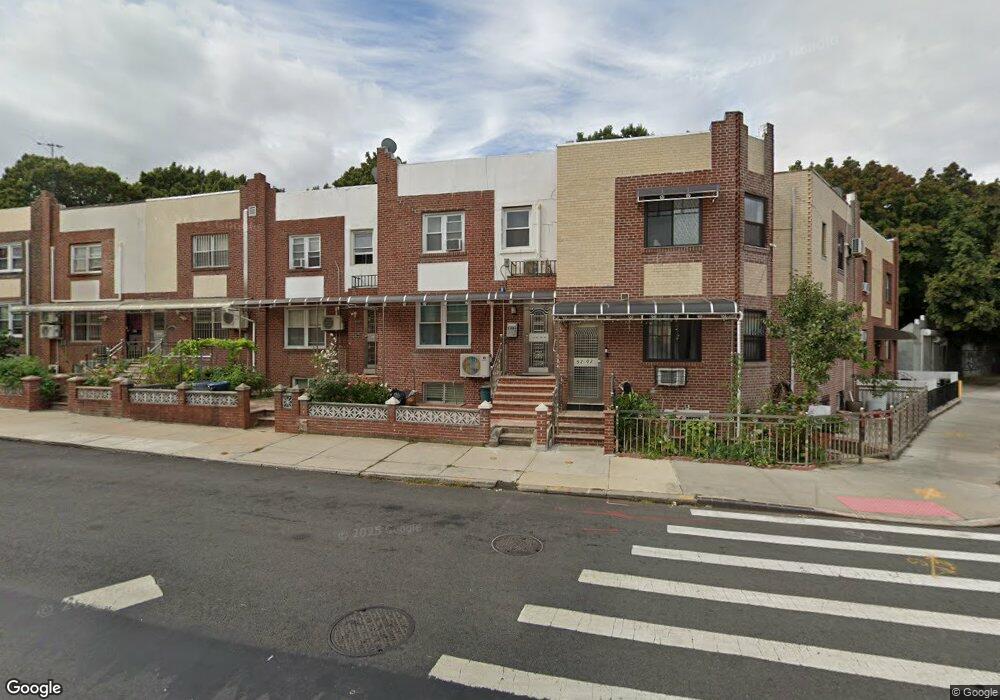
5204 79th St Elmhurst, NY 11373
Maspeth NeighborhoodEstimated Value: $931,000 - $1,005,158
Studio
--
Bath
1,280
Sq Ft
$749/Sq Ft
Est. Value
About This Home
This home is located at 5204 79th St, Elmhurst, NY 11373 and is currently estimated at $958,540, approximately $748 per square foot. 5204 79th St is a home located in Queens County with nearby schools including Ps 58 School Of Heroes, IS 73 - The Frank Sansivieri School, and Newtown High School.
Ownership History
Date
Name
Owned For
Owner Type
Purchase Details
Closed on
Jan 24, 2022
Sold by
Huang Ying Zhu and Li Deceased
Bought by
Huang Ying Zhu and Li Jie
Current Estimated Value
Purchase Details
Closed on
Nov 27, 2013
Sold by
Huang Ying Zhu and Li Yun Shou
Bought by
Huang Ying Zhu and Li Jie
Purchase Details
Closed on
Apr 29, 2008
Sold by
Chow Irene and Chow Man Wai
Bought by
Huang Ying Zhu and Li Yun Shou
Home Financials for this Owner
Home Financials are based on the most recent Mortgage that was taken out on this home.
Original Mortgage
$404,850
Interest Rate
5.91%
Mortgage Type
Purchase Money Mortgage
Purchase Details
Closed on
Jun 20, 1996
Sold by
Heyd Martina and Schidrich Martha
Bought by
Chow Man Wai and Wong Yuet Heung
Home Financials for this Owner
Home Financials are based on the most recent Mortgage that was taken out on this home.
Original Mortgage
$140,250
Interest Rate
8.37%
Create a Home Valuation Report for This Property
The Home Valuation Report is an in-depth analysis detailing your home's value as well as a comparison with similar homes in the area
Home Values in the Area
Average Home Value in this Area
Purchase History
| Date | Buyer | Sale Price | Title Company |
|---|---|---|---|
| Huang Ying Zhu | -- | -- | |
| Huang Ying Zhu | -- | -- | |
| Huang Ying Zhu | -- | -- | |
| Huang Ying Zhu | -- | -- | |
| Huang Ying Zhu | -- | -- | |
| Huang Ying Zhu | $539,800 | -- | |
| Huang Ying Zhu | $539,800 | -- | |
| Chow Man Wai | $187,000 | First American Title Ins Co | |
| Chow Man Wai | $187,000 | First American Title Ins Co |
Source: Public Records
Mortgage History
| Date | Status | Borrower | Loan Amount |
|---|---|---|---|
| Previous Owner | Huang Ying Zhu | $404,850 | |
| Previous Owner | Chow Man Wai | $140,250 |
Source: Public Records
Tax History
| Year | Tax Paid | Tax Assessment Tax Assessment Total Assessment is a certain percentage of the fair market value that is determined by local assessors to be the total taxable value of land and additions on the property. | Land | Improvement |
|---|---|---|---|---|
| 2025 | $7,513 | $38,695 | $12,475 | $26,220 |
| 2024 | $7,513 | $37,404 | $12,128 | $25,276 |
| 2023 | $7,168 | $35,686 | $11,744 | $23,942 |
| 2022 | $6,781 | $54,600 | $17,100 | $37,500 |
| 2021 | $6,490 | $54,480 | $17,100 | $37,380 |
| 2020 | $6,530 | $46,860 | $17,100 | $29,760 |
| 2019 | $6,228 | $44,220 | $17,100 | $27,120 |
| 2018 | $5,764 | $29,738 | $11,021 | $18,717 |
| 2017 | $5,470 | $28,305 | $10,931 | $17,374 |
| 2016 | $5,062 | $28,305 | $10,931 | $17,374 |
| 2015 | $3,001 | $26,872 | $12,752 | $14,120 |
| 2014 | $3,001 | $25,975 | $14,783 | $11,192 |
Source: Public Records
Map
Nearby Homes
- 74-49 Calamus Ave Unit 51
- 74-47 Calamus Ave Unit 48
- 5244 79th St
- 52-49 79th St
- 77-06 Kneeland Ave
- 7291 Calamus Ave
- 7338 52nd Rd
- 79-15 Kneeland Ave
- 5119 Ireland St
- 84-38 Grand Ave
- 54-09 80th St
- 54-07 84th St
- 70-03 52nd Ave
- 5434 83rd St
- 81-14 Queens Blvd Unit PH6C
- 8604 Grand Ave Unit 2D
- 0 Island Rd Unit S1604113
- 54-47 83rd St
- 8115 Queens Blvd Unit 3A
- 51-29 69th Place
Your Personal Tour Guide
Ask me questions while you tour the home.