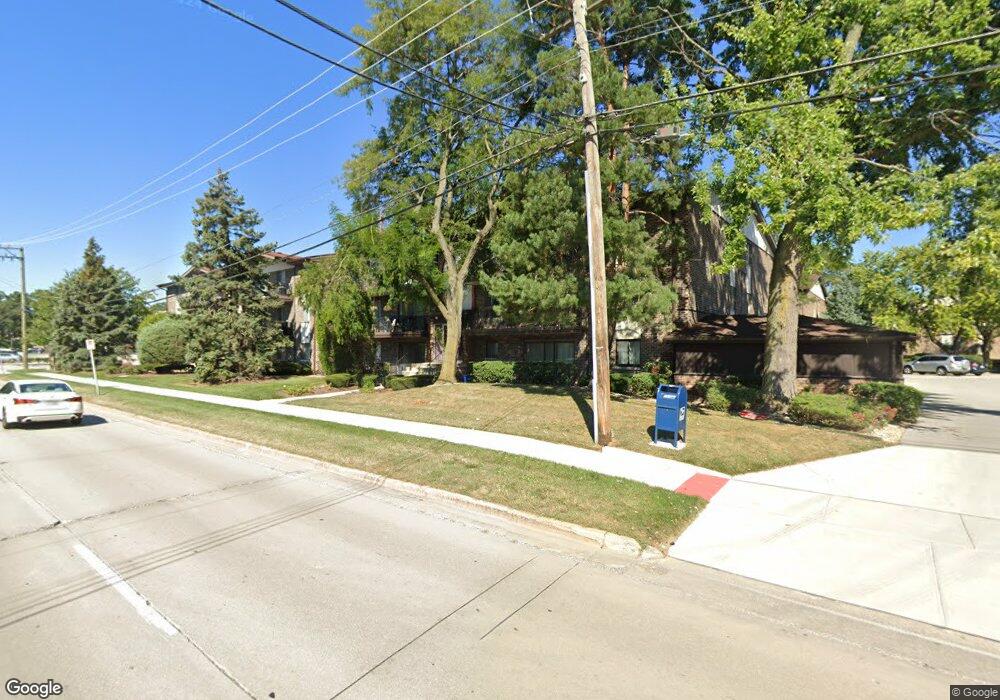
5204 Midlothian Turnpike Unit 217 Crestwood, IL 60445
Estimated Value: $156,551 - $172,000
2
Beds
1
Bath
1,200
Sq Ft
$136/Sq Ft
Est. Value
About This Home
This home is located at 5204 Midlothian Turnpike Unit 217, Crestwood, IL 60445 and is currently estimated at $162,888, approximately $135 per square foot. 5204 Midlothian Turnpike Unit 217 is a home located in Cook County with nearby schools including Lee R Foster Elementary School, Jack Hille Middle School, and Oak Forest High School.
Ownership History
Date
Name
Owned For
Owner Type
Purchase Details
Closed on
Jul 29, 2004
Sold by
Lakoskey Kimberly L and Lakoskey Gerald D
Bought by
Shelly Lisa
Current Estimated Value
Home Financials for this Owner
Home Financials are based on the most recent Mortgage that was taken out on this home.
Original Mortgage
$116,380
Outstanding Balance
$58,094
Interest Rate
6.1%
Mortgage Type
Unknown
Estimated Equity
$104,794
Purchase Details
Closed on
Mar 12, 1999
Sold by
Krebs Joseph and Krebs Steven
Bought by
Lakoskey Gerald D and Lakoskey Kimberly L
Home Financials for this Owner
Home Financials are based on the most recent Mortgage that was taken out on this home.
Original Mortgage
$77,900
Interest Rate
7.9%
Purchase Details
Closed on
Dec 14, 1998
Sold by
Krebs Joseph E
Bought by
Krebs Joseph E and Krebs Steven
Create a Home Valuation Report for This Property
The Home Valuation Report is an in-depth analysis detailing your home's value as well as a comparison with similar homes in the area
Home Values in the Area
Average Home Value in this Area
Purchase History
| Date | Buyer | Sale Price | Title Company |
|---|---|---|---|
| Shelly Lisa | $126,500 | Pntn | |
| Lakoskey Gerald D | $82,000 | Professional National Title | |
| Krebs Joseph E | -- | -- |
Source: Public Records
Mortgage History
| Date | Status | Borrower | Loan Amount |
|---|---|---|---|
| Open | Shelly Lisa | $116,380 | |
| Previous Owner | Lakoskey Gerald D | $77,900 |
Source: Public Records
Tax History Compared to Growth
Tax History
| Year | Tax Paid | Tax Assessment Tax Assessment Total Assessment is a certain percentage of the fair market value that is determined by local assessors to be the total taxable value of land and additions on the property. | Land | Improvement |
|---|---|---|---|---|
| 2024 | $2,547 | $13,459 | $759 | $12,700 |
| 2023 | $1,288 | $13,459 | $759 | $12,700 |
| 2022 | $1,288 | $7,290 | $1,139 | $6,151 |
| 2021 | $1,289 | $7,288 | $1,138 | $6,150 |
| 2020 | $1,319 | $7,288 | $1,138 | $6,150 |
| 2019 | $1,567 | $8,349 | $1,091 | $7,258 |
| 2018 | $1,552 | $8,349 | $1,091 | $7,258 |
| 2017 | $1,607 | $8,349 | $1,091 | $7,258 |
| 2016 | $1,870 | $8,087 | $949 | $7,138 |
| 2015 | $1,795 | $8,087 | $949 | $7,138 |
| 2014 | $1,781 | $8,087 | $949 | $7,138 |
| 2013 | $2,371 | $10,770 | $949 | $9,821 |
Source: Public Records
Map
Nearby Homes
- 5204 Midlothian Turnpike Unit 222
- 5333 Waterbury Way Unit 503A
- 13933 James Dr Unit 816
- 13933 James Dr Unit 820
- 13919 James Dr Unit 903
- 14004 Waterbury Dr Unit 1106
- 14051 E Laramie Ct
- 13942 Long Ave
- 13919 W Leamington Dr Unit 806
- 5409 138th Place
- 5041 139th Place Unit 406
- 5437 138th Place
- 5018 Midlothian Turnpike Unit 1009
- 13706 Crestview Ct
- 13537 Latrobe Ave Unit 7
- 13533 Short Dr
- 13515 Le Claire Ave Unit 56
- 13520 Lawler Ave Unit 42
- 13540 Lawler Ave Unit 83
- 13635 Lamon Ave Unit A21
- 5204 Midlothian Turnpike Unit 225
- 5204 Midlothian Turnpike Unit 223
- 5204 Midlothian Turnpike Unit 216
- 5204 Midlothian Turnpike Unit 213
- 5204 Midlothian Turnpike Unit 224
- 5204 Midlothian Turnpike Unit 221
- 5204 Midlothian Turnpike Unit 218
- 5204 Midlothian Turnpike Unit 219
- 5204 Midlothian Turnpike Unit 215
- 5204 Midlothian Turnpike Unit 220
- 5204 Midlothian Turnpike Unit 231
- 5204 Midlothian Turnpike Unit 228
- 5204 Midlothian Turnpike Unit 227
- 5206 Midlothian Turnpike Unit 230
- 5206 Midlothian Turnpike Unit 205
- 5206 Midlothian Turnpike Unit 201
- 5206 Midlothian Turnpike Unit 211
- 5206 Midlothian Turnpike Unit 210
- 5206 Midlothian Turnpike Unit 209
- 5206 Midlothian Turnpike Unit 202