Estimated Value: $413,000 - $421,000
4
Beds
3
Baths
2,887
Sq Ft
$145/Sq Ft
Est. Value
About This Home
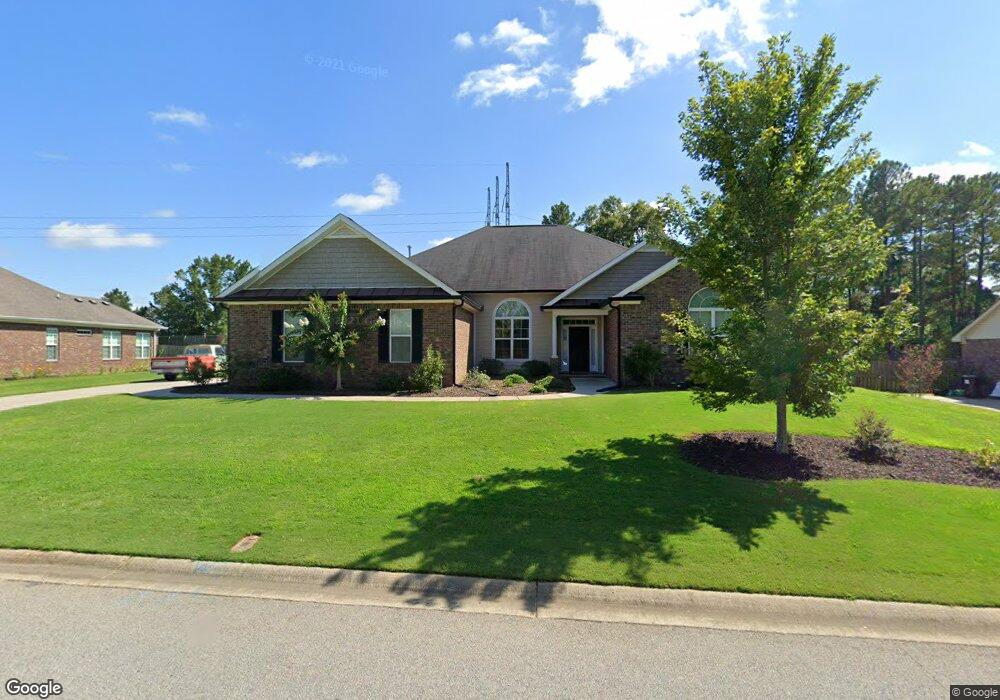
This home is located at 5204 Tilton Dr, Evans, GA 30809 and is currently estimated at $417,536, approximately $144 per square foot. 5204 Tilton Dr is a home located in Columbia County with nearby schools including Lewiston Elementary School, Evans Middle School, and NeoCity Academy.
Ownership History
Date
Name
Owned For
Owner Type
Purchase Details
Closed on
May 31, 2011
Sold by
Pierwood Const Co
Bought by
Moore Derek L
Current Estimated Value
Home Financials for this Owner
Home Financials are based on the most recent Mortgage that was taken out on this home.
Original Mortgage
$254,900
Outstanding Balance
$175,750
Interest Rate
4.71%
Mortgage Type
VA
Estimated Equity
$241,786
Purchase Details
Closed on
Nov 18, 2010
Sold by
Regis Development Co
Bought by
Pierwood Construction Co
Home Financials for this Owner
Home Financials are based on the most recent Mortgage that was taken out on this home.
Original Mortgage
$582,000
Interest Rate
4.37%
Mortgage Type
New Conventional
Purchase Details
Closed on
Nov 1, 2010
Sold by
Regis Dev Co
Bought by
Pierwood Const Co
Home Financials for this Owner
Home Financials are based on the most recent Mortgage that was taken out on this home.
Original Mortgage
$582,000
Interest Rate
4.37%
Mortgage Type
New Conventional
Create a Home Valuation Report for This Property
The Home Valuation Report is an in-depth analysis detailing your home's value as well as a comparison with similar homes in the area
Home Values in the Area
Average Home Value in this Area
Purchase History
| Date | Buyer | Sale Price | Title Company |
|---|---|---|---|
| Moore Derek L | $254,900 | -- | |
| Moore Derek L | $254,900 | -- | |
| Pierwood Construction Co | $119,700 | -- | |
| Pierwood Const Co | $119,700 | -- |
Source: Public Records
Mortgage History
| Date | Status | Borrower | Loan Amount |
|---|---|---|---|
| Open | Moore Derek L | $254,900 | |
| Closed | Moore Derek L | $254,900 | |
| Previous Owner | Pierwood Construction Co | $582,000 | |
| Previous Owner | Pierwood Const Co | $582,000 |
Source: Public Records
Tax History Compared to Growth
Tax History
| Year | Tax Paid | Tax Assessment Tax Assessment Total Assessment is a certain percentage of the fair market value that is determined by local assessors to be the total taxable value of land and additions on the property. | Land | Improvement |
|---|---|---|---|---|
| 2025 | $3,812 | $157,430 | $29,004 | $128,426 |
| 2024 | $4,003 | $157,898 | $27,404 | $130,494 |
| 2023 | $4,003 | $152,667 | $26,904 | $125,763 |
| 2022 | $3,509 | $132,806 | $24,104 | $108,702 |
| 2021 | $3,377 | $122,096 | $22,304 | $99,792 |
| 2020 | $3,178 | $112,374 | $21,004 | $91,370 |
| 2019 | $3,125 | $110,474 | $20,804 | $89,670 |
| 2018 | $3,089 | $108,817 | $20,004 | $88,813 |
| 2017 | $3,073 | $107,863 | $19,404 | $88,459 |
| 2016 | $2,898 | $105,342 | $18,880 | $86,462 |
| 2015 | $2,719 | $98,528 | $18,580 | $79,948 |
| 2014 | $2,697 | $96,482 | $18,580 | $77,902 |
Source: Public Records
Map
Nearby Homes
- 5079 Wells Dr
- 5108 Wells Dr
- 804 Wells Ct
- 2229 Millshaven Trail
- 960 Woody Hill Cir
- 964 Woody Hill Cir
- 805 Leslie Ct
- 982 Woody Hill Cir
- 928 Rollo Domino Cir
- 642 Cornerstone Place
- 709 Whitney Shoals Rd
- 707 Whitney Shoals Rd
- 3246 Windwood St
- 712 Whitney Shoals Rd
- 484 Dickson Dr
- 1248 Berkley Hills Pass
- 2430 Sunflower Dr
- 671 Whitney Shoals Rd
- 4879 Flagstone Ct
- 1459 Knob Hill Cir
- 5206 Tilton Dr
- 5202 Tilton Dr
- 5208 Tilton Dr
- 424 Weyanoke Dr
- 5205 Tilton Dr
- 5200 Tilton Dr
- 422 Weyanoke Dr
- 5201 Tilton Dr
- 5210 Tilton Dr
- 5209 Tilton Dr
- 483 Weyanoke Dr
- 434 Weyanoke Dr
- 5089 Wells Dr
- 482 Weyanoke Dr
- 5091 Wells Dr
- 5212 Tilton Dr
- 5093 Wells Dr
- 5087 Wells Dr
- 480 Weyanoke Dr
- 436 Weyanoke Dr