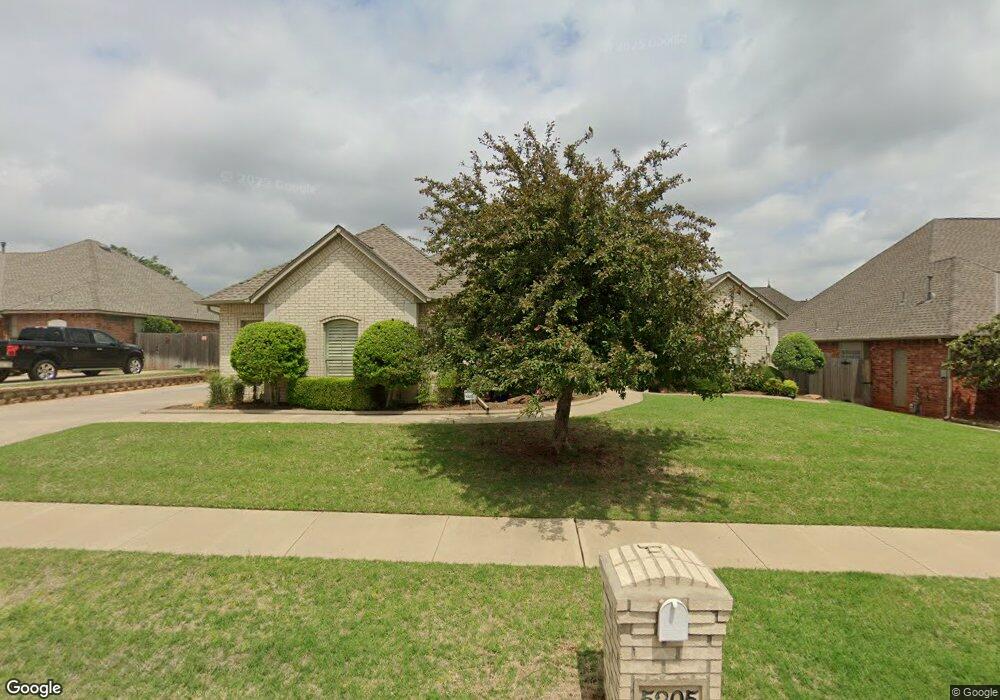
5205 NW 120th St Oklahoma City, OK 73162
Glenhurst NeighborhoodEstimated Value: $416,000 - $446,000
3
Beds
3
Baths
2,681
Sq Ft
$160/Sq Ft
Est. Value
About This Home
This home is located at 5205 NW 120th St, Oklahoma City, OK 73162 and is currently estimated at $428,728, approximately $159 per square foot. 5205 NW 120th St is a home located in Oklahoma County with nearby schools including Dennis Elementary School, Hefner Middle School, and Putnam City North High School.
Ownership History
Date
Name
Owned For
Owner Type
Purchase Details
Closed on
May 14, 2020
Sold by
Speegle Michael W and Speegle Sharon K
Bought by
Mike Speegle And Sharon Speegle Rev Tr
Current Estimated Value
Purchase Details
Closed on
Aug 31, 2009
Sold by
Samara May Frances and John R Samara Living Trust
Bought by
Speegle Michael W and Speegle Sharon K
Home Financials for this Owner
Home Financials are based on the most recent Mortgage that was taken out on this home.
Original Mortgage
$161,000
Outstanding Balance
$105,667
Interest Rate
5.26%
Mortgage Type
New Conventional
Estimated Equity
$323,061
Purchase Details
Closed on
Mar 30, 2005
Sold by
Churck Robinson Homes Inc
Bought by
Samara John R and Samara May Frances
Purchase Details
Closed on
Jul 20, 2004
Sold by
First American Title & Trust Co
Bought by
Chuck Robinson Homes Inc
Home Financials for this Owner
Home Financials are based on the most recent Mortgage that was taken out on this home.
Original Mortgage
$207,200
Interest Rate
6.26%
Mortgage Type
Purchase Money Mortgage
Create a Home Valuation Report for This Property
The Home Valuation Report is an in-depth analysis detailing your home's value as well as a comparison with similar homes in the area
Home Values in the Area
Average Home Value in this Area
Purchase History
| Date | Buyer | Sale Price | Title Company |
|---|---|---|---|
| Mike Speegle And Sharon Speegle Rev Tr | -- | None Available | |
| Speegle Michael W | $260,000 | Capitol Abstract & Title Co | |
| Samara John R | $259,500 | Stewart Abstract & Title Co | |
| Chuck Robinson Homes Inc | $39,500 | American Guaranty Title Co |
Source: Public Records
Mortgage History
| Date | Status | Borrower | Loan Amount |
|---|---|---|---|
| Open | Speegle Michael W | $161,000 | |
| Previous Owner | Chuck Robinson Homes Inc | $207,200 |
Source: Public Records
Tax History Compared to Growth
Tax History
| Year | Tax Paid | Tax Assessment Tax Assessment Total Assessment is a certain percentage of the fair market value that is determined by local assessors to be the total taxable value of land and additions on the property. | Land | Improvement |
|---|---|---|---|---|
| 2024 | $4,270 | $37,104 | $5,531 | $31,573 |
| 2023 | $4,270 | $36,024 | $5,649 | $30,375 |
| 2022 | $4,193 | $34,974 | $5,929 | $29,045 |
| 2021 | $4,028 | $33,956 | $6,457 | $27,499 |
| 2020 | $3,890 | $32,967 | $6,501 | $26,466 |
| 2019 | $3,717 | $32,007 | $6,418 | $25,589 |
| 2018 | $3,610 | $31,075 | $0 | $0 |
| 2017 | $3,508 | $30,174 | $5,677 | $24,497 |
| 2016 | $3,396 | $29,294 | $5,809 | $23,485 |
| 2015 | $3,333 | $28,441 | $5,607 | $22,834 |
| 2014 | $3,109 | $27,613 | $6,238 | $21,375 |
Source: Public Records
Map
Nearby Homes
- 12300 St Lukes Ln
- 5509 NW 120th St
- 12300 Maiden Ln
- 5408 NW 119th Terrace
- 5204 NW 118th Cir
- 5509 NW 121st St
- 12308 Val Verde Dr
- 12220 Banyan Ln
- 4704 Hemlock Ln
- 5309 NW 123rd St
- 4702 Hemlock Ln
- 4713 Cypress Ct
- 11917 Dornick Cir
- 5001 Misty Glen Cir
- 11824 Bellhurst Ave
- 5613 NW 115th St
- 12701 Downsview Ln
- 11717 Bellhurst Ave
- 4609 NW 119th St
- 4428 Day Lilly Ln
- 5209 NW 120th St
- 5201 NW 120th St
- 5204 NW 121st St
- 5300 NW 121st St
- 5200 NW 121st St
- 5301 NW 120th St
- 5204 NW 120th St
- 5208 NW 120th St
- 12009 Wileman Way
- 5304 NW 121st St
- 5300 NW 120th St
- 5305 NW 120th St
- 12100 Wileman Way
- 12104 Wileman Way
- 12012 Wileman Way
- 5308 NW 121st St
- 5205 NW 121st St
- 5205 NW 119th St
- 5304 NW 120th St
- 12108 Wileman Way