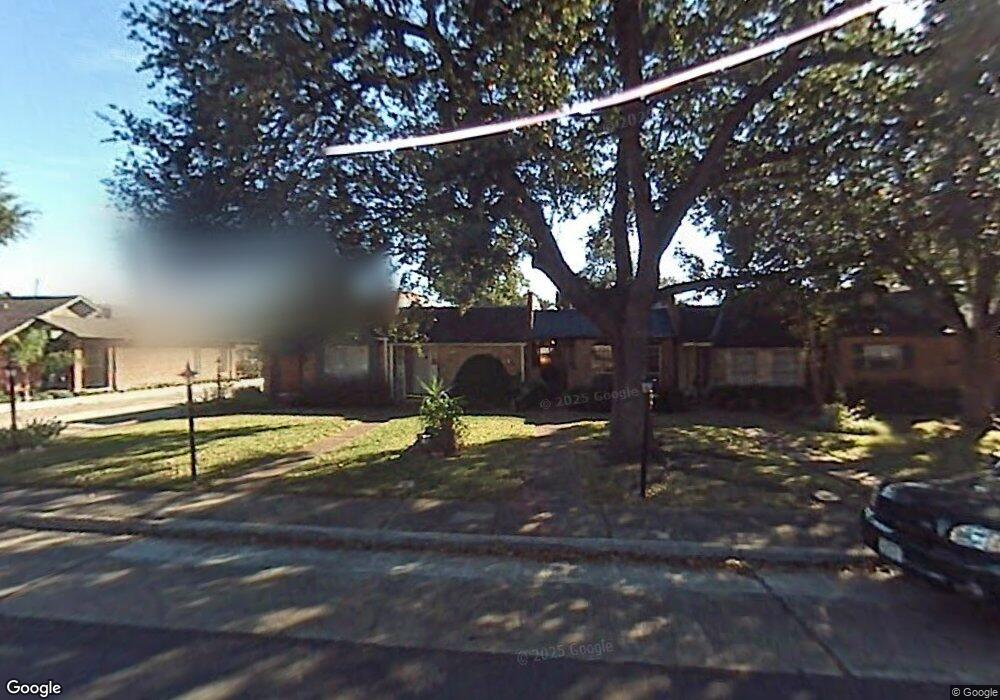
5205 Palmetto St Unit D Bellaire, TX 77401
Estimated Value: $323,422 - $688,000
2
Beds
2
Baths
1,372
Sq Ft
$330/Sq Ft
Est. Value
About This Home
This home is located at 5205 Palmetto St Unit D, Bellaire, TX 77401 and is currently estimated at $453,106, approximately $330 per square foot. 5205 Palmetto St Unit D is a home located in Harris County with nearby schools including Condit Elementary School, Pershing Middle School, and Bellaire High School.
Ownership History
Date
Name
Owned For
Owner Type
Purchase Details
Closed on
Nov 2, 2020
Sold by
Mullins Georgianna Lea and Estate Of John Conrad Massey
Bought by
Mullins Mary Megan and Friedman Benjamin Isaac
Current Estimated Value
Purchase Details
Closed on
Oct 25, 2017
Sold by
Thornton Massey Shella Lea and Massey John Conrad
Bought by
Massey John Conrad
Purchase Details
Closed on
Apr 20, 2017
Sold by
Massey John Conrad and Massey Shella Thornton
Bought by
Bopp Julia Ann and Mullins Georgianna Lea
Purchase Details
Closed on
Oct 17, 2002
Sold by
Huard Robert J and Huard Lola L
Bought by
Mcneel Gary P and Mcneel Jane M
Home Financials for this Owner
Home Financials are based on the most recent Mortgage that was taken out on this home.
Original Mortgage
$92,000
Interest Rate
6.09%
Create a Home Valuation Report for This Property
The Home Valuation Report is an in-depth analysis detailing your home's value as well as a comparison with similar homes in the area
Home Values in the Area
Average Home Value in this Area
Purchase History
| Date | Buyer | Sale Price | Title Company |
|---|---|---|---|
| Mullins Mary Megan | -- | None Available | |
| Massey John Conrad | -- | None Available | |
| Bopp Julia Ann | -- | None Listed On Document | |
| Mcneel Gary P | -- | Texas American Title Company |
Source: Public Records
Mortgage History
| Date | Status | Borrower | Loan Amount |
|---|---|---|---|
| Previous Owner | Mcneel Gary P | $92,000 |
Source: Public Records
Tax History Compared to Growth
Tax History
| Year | Tax Paid | Tax Assessment Tax Assessment Total Assessment is a certain percentage of the fair market value that is determined by local assessors to be the total taxable value of land and additions on the property. | Land | Improvement |
|---|---|---|---|---|
| 2025 | $3,081 | $242,169 | $157,950 | $84,219 |
| 2024 | $3,081 | $245,577 | $157,950 | $87,627 |
| 2023 | $3,081 | $245,577 | $157,950 | $87,627 |
| 2022 | $4,908 | $231,974 | $157,950 | $74,024 |
| 2021 | $5,166 | $231,974 | $157,950 | $74,024 |
| 2020 | $5,338 | $231,974 | $157,950 | $74,024 |
| 2019 | $5,571 | $234,712 | $157,950 | $76,762 |
| 2018 | $5,571 | $234,712 | $157,950 | $76,762 |
| 2017 | $4,263 | $234,712 | $157,950 | $76,762 |
| 2016 | $3,876 | $234,712 | $157,950 | $76,762 |
| 2015 | $788 | $164,730 | $102,060 | $62,670 |
| 2014 | $788 | $148,977 | $89,910 | $59,067 |
Source: Public Records
Map
Nearby Homes
- 5200 Beech St
- 6318 Ferris Dr
- 5230 Woodlawn Place Unit 11
- 6410 Ferris Dr Unit 14
- 6305 S Rice Ave
- 5004 Chestnut St
- 5005 Chestnut St
- 5001 Beech St
- 6205 S Rice Ave
- 4918 Chestnut St
- 4809 Elm St
- 4912 Bellaire Blvd
- 4906 Wedgewood Dr
- 5213 Linden St
- 6302 1st St
- 4916 Linden St
- 4909 Mayfair St
- 7134 Mapleridge St Unit 3G
- 5118 Aspen St
- 5050 Glenmont Dr Unit F5
- 5205 Palmetto St
- 5205 Palmetto St
- 5205 Palmetto St
- 5205 Palmetto St
- 5205 Palmetto St
- 5205 Palmetto St
- 5205 Palmetto St
- 5205 Palmetto St
- 5205 Palmetto St
- 5205 Palmetto St
- 5205 Palmetto St
- 5205 Palmetto St
- 5205 Palmetto St Unit J
- 5205 Palmetto St Unit F
- 5205 Palmetto St Unit L
- 5205 Palmetto St Unit C
- 5205 Palmetto St Unit G
- 5205 Palmetto St Unit I
- 5203 Palmetto St
- 5208 Beech St