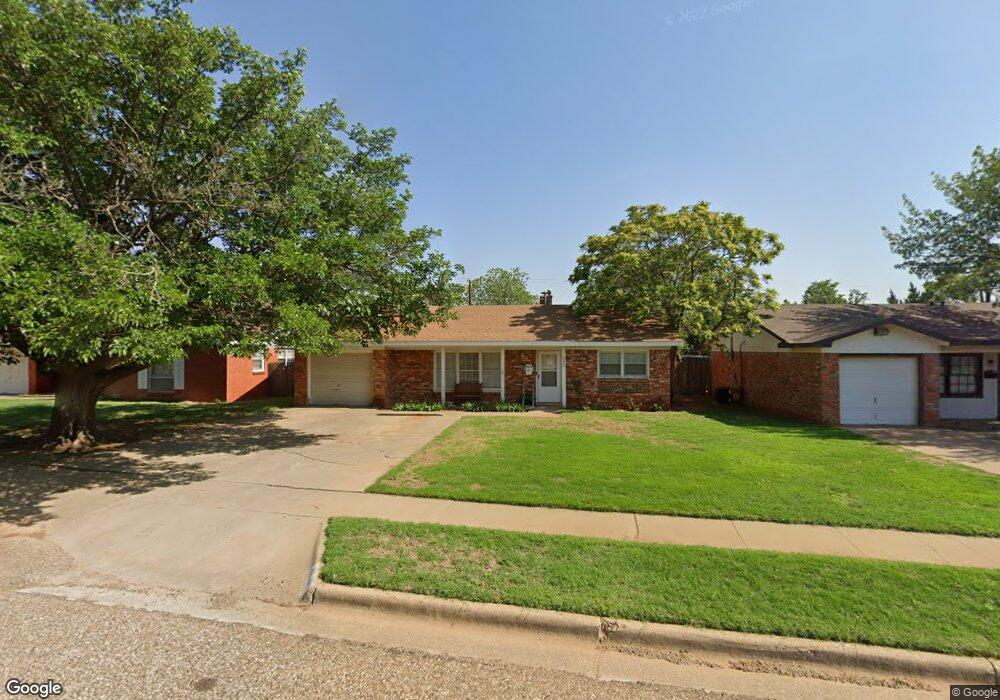
5206 45th St Lubbock, TX 79414
Wester NeighborhoodEstimated Value: $156,000 - $177,685
3
Beds
2
Baths
1,499
Sq Ft
$111/Sq Ft
Est. Value
About This Home
This home is located at 5206 45th St, Lubbock, TX 79414 and is currently estimated at $166,921, approximately $111 per square foot. 5206 45th St is a home located in Lubbock County with nearby schools including Wester Elementary School, Commander William C. McCool Academy, and Irons Middle School.
Ownership History
Date
Name
Owned For
Owner Type
Purchase Details
Closed on
Apr 18, 2007
Sold by
Lyles Travis and Lyles Evelyn
Bought by
Gray Jason Edward and Gray Rosario Ann
Current Estimated Value
Home Financials for this Owner
Home Financials are based on the most recent Mortgage that was taken out on this home.
Original Mortgage
$86,020
Outstanding Balance
$52,010
Interest Rate
6.15%
Mortgage Type
Purchase Money Mortgage
Estimated Equity
$114,911
Purchase Details
Closed on
Aug 13, 1993
Bought by
Gray Jason E and Gray Rosario A
Create a Home Valuation Report for This Property
The Home Valuation Report is an in-depth analysis detailing your home's value as well as a comparison with similar homes in the area
Home Values in the Area
Average Home Value in this Area
Purchase History
| Date | Buyer | Sale Price | Title Company |
|---|---|---|---|
| Gray Jason Edward | -- | Western Title Company | |
| Gray Jason E | -- | -- |
Source: Public Records
Mortgage History
| Date | Status | Borrower | Loan Amount |
|---|---|---|---|
| Open | Gray Jason Edward | $86,020 |
Source: Public Records
Tax History Compared to Growth
Tax History
| Year | Tax Paid | Tax Assessment Tax Assessment Total Assessment is a certain percentage of the fair market value that is determined by local assessors to be the total taxable value of land and additions on the property. | Land | Improvement |
|---|---|---|---|---|
| 2025 | $2,095 | $175,002 | $29,000 | $146,002 |
| 2024 | $2,095 | $172,299 | $29,000 | $143,299 |
| 2023 | $1,871 | $150,340 | $9,045 | $167,632 |
| 2022 | $2,767 | $136,673 | $9,045 | $135,187 |
| 2021 | $2,661 | $124,248 | $9,045 | $115,203 |
| 2020 | $2,531 | $116,412 | $9,045 | $107,367 |
| 2019 | $2,525 | $112,493 | $9,045 | $103,448 |
| 2018 | $2,452 | $109,087 | $9,045 | $100,042 |
| 2017 | $2,232 | $99,170 | $9,045 | $90,125 |
| 2016 | $2,166 | $96,225 | $9,045 | $87,180 |
| 2015 | $1,693 | $90,002 | $6,030 | $83,972 |
| 2014 | $1,693 | $84,478 | $6,030 | $78,448 |
Source: Public Records
Map
Nearby Homes