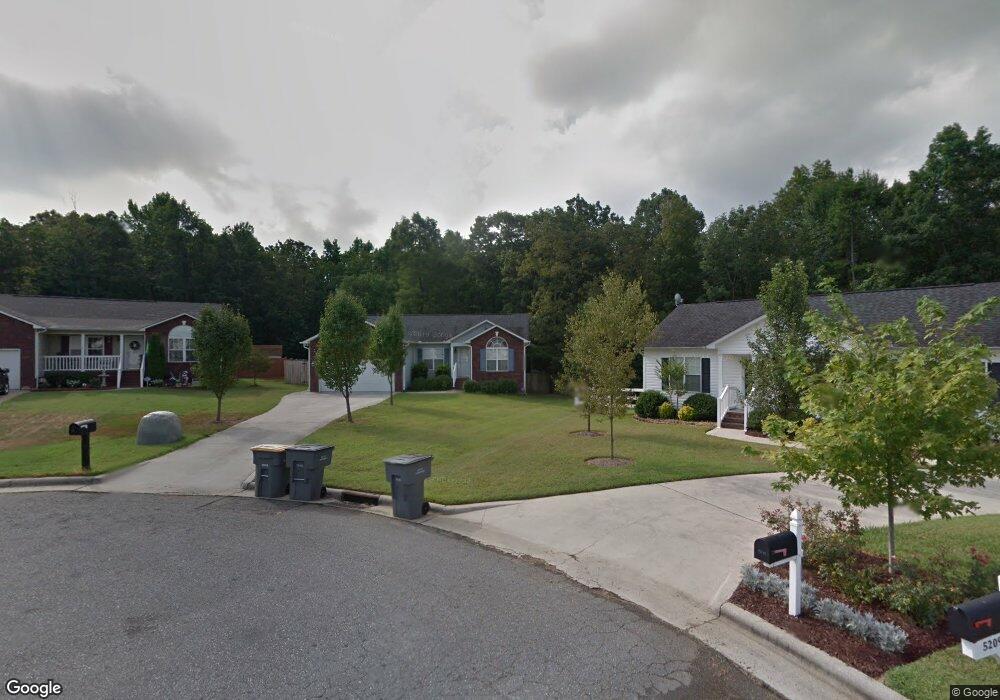
5206 Harmon Place Kannapolis, NC 28083
Estimated Value: $299,000 - $332,000
3
Beds
2
Baths
1,374
Sq Ft
$228/Sq Ft
Est. Value
About This Home
This home is located at 5206 Harmon Place, Kannapolis, NC 28083 and is currently estimated at $312,763, approximately $227 per square foot. 5206 Harmon Place is a home located in Cabarrus County with nearby schools including Royal Oaks Elementary School, Concord Middle School, and Concord High School.
Ownership History
Date
Name
Owned For
Owner Type
Purchase Details
Closed on
May 11, 2006
Sold by
North Adam J and North Jessica Sky
Bought by
Graham Benjamin Todd
Current Estimated Value
Home Financials for this Owner
Home Financials are based on the most recent Mortgage that was taken out on this home.
Original Mortgage
$26,980
Interest Rate
6%
Mortgage Type
Stand Alone Second
Purchase Details
Closed on
Apr 25, 2003
Sold by
Bost Development Of Cabarrus Inc
Bought by
North Adam J and North Jessica Sky
Home Financials for this Owner
Home Financials are based on the most recent Mortgage that was taken out on this home.
Original Mortgage
$129,500
Interest Rate
5.6%
Purchase Details
Closed on
Feb 4, 2002
Sold by
Bost Danny G
Bought by
Bost Development Of Cabarrus Inc
Home Financials for this Owner
Home Financials are based on the most recent Mortgage that was taken out on this home.
Original Mortgage
$26,000
Interest Rate
5.95%
Mortgage Type
Construction
Create a Home Valuation Report for This Property
The Home Valuation Report is an in-depth analysis detailing your home's value as well as a comparison with similar homes in the area
Home Values in the Area
Average Home Value in this Area
Purchase History
| Date | Buyer | Sale Price | Title Company |
|---|---|---|---|
| Graham Benjamin Todd | $135,000 | None Available | |
| North Adam J | $129,500 | -- | |
| Bost Development Of Cabarrus Inc | $26,000 | -- |
Source: Public Records
Mortgage History
| Date | Status | Borrower | Loan Amount |
|---|---|---|---|
| Closed | Graham Benjamin Todd | $26,980 | |
| Open | Graham Benjamin Todd | $107,900 | |
| Previous Owner | North Adam J | $129,500 | |
| Previous Owner | Bost Development Of Cabarrus Inc | $26,000 |
Source: Public Records
Tax History Compared to Growth
Tax History
| Year | Tax Paid | Tax Assessment Tax Assessment Total Assessment is a certain percentage of the fair market value that is determined by local assessors to be the total taxable value of land and additions on the property. | Land | Improvement |
|---|---|---|---|---|
| 2025 | $3,829 | $337,170 | $66,000 | $271,170 |
| 2024 | $3,829 | $337,170 | $66,000 | $271,170 |
| 2023 | $2,333 | $170,320 | $36,000 | $134,320 |
| 2022 | $2,201 | $160,650 | $36,000 | $124,650 |
| 2021 | $2,201 | $160,650 | $36,000 | $124,650 |
| 2020 | $2,201 | $160,650 | $36,000 | $124,650 |
| 2019 | $1,446 | $105,570 | $20,000 | $85,570 |
| 2018 | $1,425 | $105,570 | $20,000 | $85,570 |
| 2017 | $1,404 | $105,570 | $20,000 | $85,570 |
| 2016 | $1,404 | $111,510 | $24,000 | $87,510 |
| 2015 | -- | $111,510 | $24,000 | $87,510 |
| 2014 | -- | $111,510 | $24,000 | $87,510 |
Source: Public Records
Map
Nearby Homes
- 3397 Camp Julia Rd
- 5100 Patterson Rd
- 2707 Ireton Place
- 4849 Samuel Richard St
- 3075 Simmons St
- 2882 Centergrove Rd
- 2018 Osborne Rd
- 3007 Centergrove Rd
- 0000 Lane St
- 2412 Brantley Rd
- 925 Anchor Way NE
- 4750 J W Cline Rd
- 839 Anchor Way NE
- 2551 Glenwood St
- 252 Forest Pond Rd
- 2495 Centergrove Rd
- 915 Harbour View Cove NE
- 2550 Echerd St
- 2660 Trawler Way
- 516 Collins St
- 5210 Harmon Place
- 5205 Harmon Place
- 5218 Harmon Place
- 5224 Harmon Place
- 2559 Harmon Place
- 5209 Harmon Place
- 5217 Harmon Place
- 5230 Harmon Place
- 5223 Harmon Place
- 5236 Harmon Place
- 5229 Harmon Place
- 5203 Halverson Ct
- 5204 Halverson Ct
- 5242 Harmon Place
- 5209 Halverson Ct
- 5241 Harmon Place
- 5210 Halverson Ct
- 5248 Harmon Place
- 5247 Harmon Place
- 5216 Halverson Ct