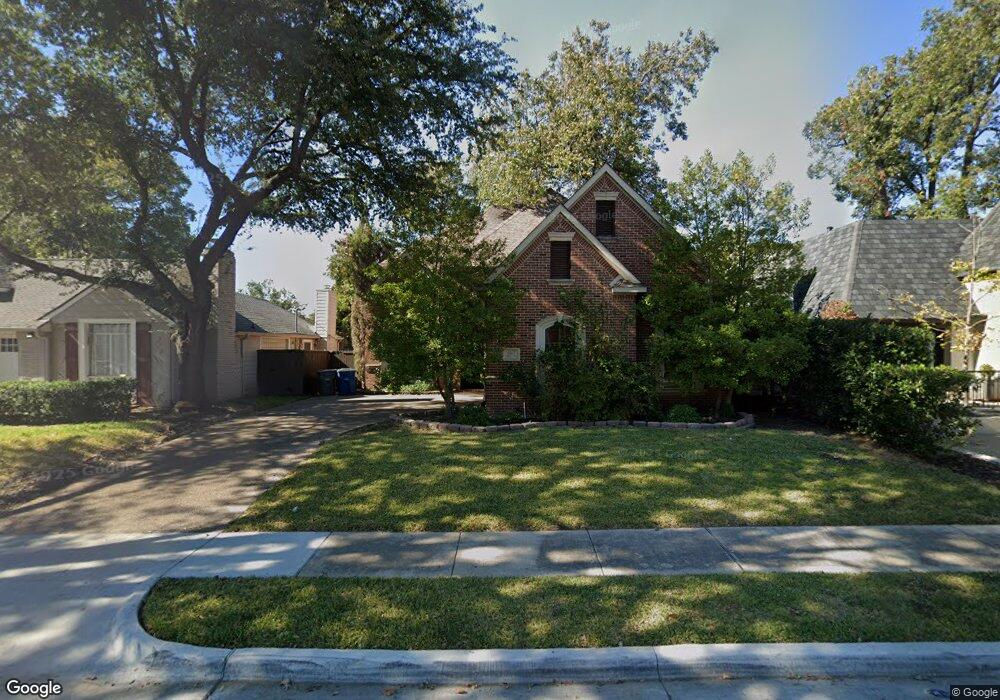
5207 Milam St Dallas, TX 75206
Old East Dallas NeighborhoodEstimated Value: $1,229,374 - $1,583,000
3
Beds
3
Baths
3,514
Sq Ft
$389/Sq Ft
Est. Value
About This Home
This home is located at 5207 Milam St, Dallas, TX 75206 and is currently estimated at $1,366,594, approximately $388 per square foot. 5207 Milam St is a home located in Dallas County with nearby schools including J L Long Middle School, Woodrow Wilson High School, and The Saint Timothy School.
Ownership History
Date
Name
Owned For
Owner Type
Purchase Details
Closed on
Nov 6, 2015
Sold by
Imai Akira
Bought by
Galland Marc
Current Estimated Value
Home Financials for this Owner
Home Financials are based on the most recent Mortgage that was taken out on this home.
Original Mortgage
$72,150
Outstanding Balance
$29,595
Interest Rate
3.8%
Mortgage Type
Stand Alone Second
Estimated Equity
$1,336,999
Purchase Details
Closed on
Feb 7, 2008
Sold by
Imai Akira and Imai Tracy
Bought by
Imai Akira
Purchase Details
Closed on
Dec 22, 2006
Sold by
Stanzel Paul
Bought by
Imai Akira and Imai Tracy
Home Financials for this Owner
Home Financials are based on the most recent Mortgage that was taken out on this home.
Original Mortgage
$52,750
Interest Rate
6.2%
Mortgage Type
Stand Alone Second
Purchase Details
Closed on
Jun 24, 2005
Sold by
Reynolds Eunice B
Bought by
Bartos Mark Thomas and Bartos April Lynn
Create a Home Valuation Report for This Property
The Home Valuation Report is an in-depth analysis detailing your home's value as well as a comparison with similar homes in the area
Home Values in the Area
Average Home Value in this Area
Purchase History
| Date | Buyer | Sale Price | Title Company |
|---|---|---|---|
| Galland Marc | -- | Rtt | |
| Imai Akira | -- | Rtt | |
| Imai Akira | -- | Rtt | |
| Bartos Mark Thomas | -- | -- |
Source: Public Records
Mortgage History
| Date | Status | Borrower | Loan Amount |
|---|---|---|---|
| Open | Galland Marc | $72,150 | |
| Open | Galland Marc | $577,200 | |
| Previous Owner | Imai Akira | $52,750 | |
| Previous Owner | Imai Akira | $416,700 |
Source: Public Records
Tax History Compared to Growth
Tax History
| Year | Tax Paid | Tax Assessment Tax Assessment Total Assessment is a certain percentage of the fair market value that is determined by local assessors to be the total taxable value of land and additions on the property. | Land | Improvement |
|---|---|---|---|---|
| 2025 | $17,272 | $1,125,860 | $295,000 | $830,860 |
| 2024 | $17,272 | $1,125,860 | $295,000 | $830,860 |
| 2023 | $17,272 | $879,800 | $295,000 | $584,800 |
| 2022 | $21,566 | $862,510 | $265,500 | $597,010 |
| 2021 | $22,680 | $859,740 | $236,000 | $623,740 |
| 2020 | $23,324 | $859,740 | $236,000 | $623,740 |
| 2019 | $24,462 | $859,740 | $236,000 | $623,740 |
| 2018 | $19,221 | $706,850 | $177,000 | $529,850 |
| 2017 | $19,221 | $706,850 | $177,000 | $529,850 |
| 2016 | $15,963 | $706,850 | $177,000 | $529,850 |
| 2015 | $12,084 | $541,910 | $147,500 | $394,410 |
| 2014 | $12,084 | $528,550 | $147,500 | $381,050 |
Source: Public Records
Map
Nearby Homes
- 5114 Alcott St
- 5020-5022 Pershing St
- 5020 Pershing St
- 5029 Pershing St
- 5009 Milam St
- 2802 Lee St
- 5230 Richard Ave
- 5220 Bonita Ave
- 5016 Vickery Blvd
- 4924 Alcott St
- 4931 Homer St
- 4915 Alcott St
- 4923 Homer St
- 2623 N Garrett Ave
- 2626 Madera St
- 5135 Vickery Blvd Unit A
- 5000 Mission Ave
- 5231 Manett St
- 5230 Vickery Blvd
- 4232 Mckinney Ave Unit 106
- 5211 Milam St
- 5203 Milam St
- 5215 Milam St
- 5127 Milam St
- 5202 Pershing St
- 5206 Pershing St
- 5126 Pershing St
- 5219 Milam St
- 5123 Milam St
- 5210 Pershing St
- 5206 Milam St
- 5122 Pershing St
- 5208 Milam St
- 5202 Milam St
- 5210 Milam St
- 5214 Pershing St
- 5119 Milam St
- 5118 Pershing St
- 5216 Milam St
- 5216 Milam St