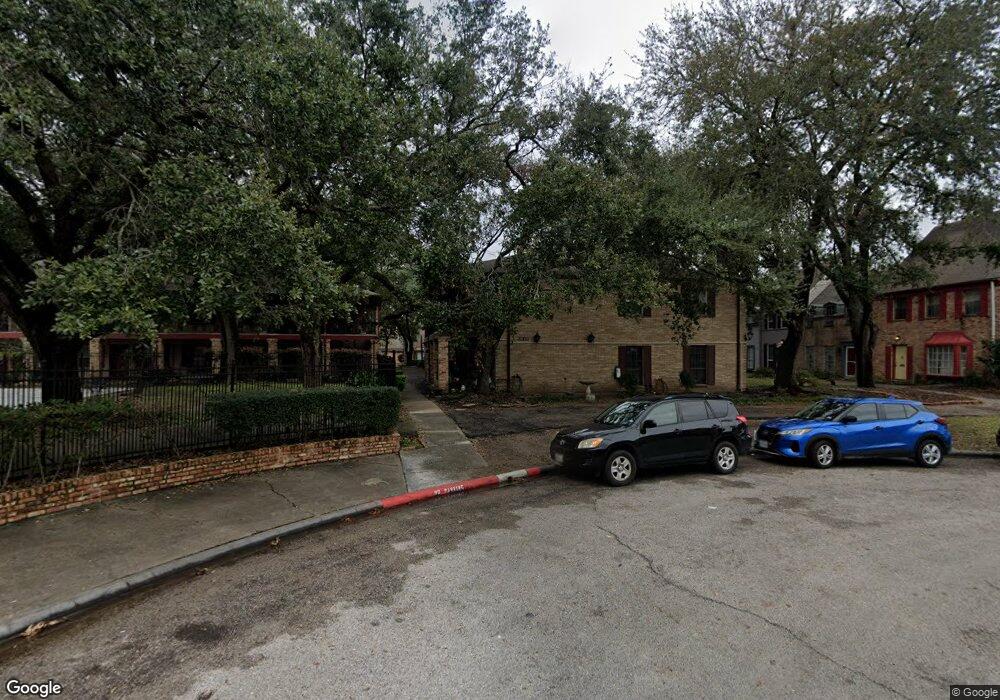
5208 Arboles Dr Unit 11 Houston, TX 77035
Westbury NeighborhoodEstimated Value: $91,000 - $97,000
1
Bed
1
Bath
736
Sq Ft
$129/Sq Ft
Est. Value
About This Home
This home is located at 5208 Arboles Dr Unit 11, Houston, TX 77035 and is currently estimated at $94,618, approximately $128 per square foot. 5208 Arboles Dr Unit 11 is a home located in Harris County with nearby schools including Parker Elementary School, Meyerland Middle, and Westbury High School.
Ownership History
Date
Name
Owned For
Owner Type
Purchase Details
Closed on
Feb 21, 2013
Sold by
Talley Ronald Eddy
Bought by
Eiben Kendall
Current Estimated Value
Purchase Details
Closed on
May 17, 2010
Sold by
Federal Home Loan Mortgage Corporation
Bought by
Talley Ronald Eddy
Purchase Details
Closed on
Mar 2, 2010
Sold by
Egan Wyer Jonathan G
Bought by
Federal Home Loan Mortgage Corp
Purchase Details
Closed on
Jul 8, 2008
Sold by
Stoutt Nancy
Bought by
Egan Wyer Jonathan G
Home Financials for this Owner
Home Financials are based on the most recent Mortgage that was taken out on this home.
Original Mortgage
$36,250
Interest Rate
6.11%
Mortgage Type
Purchase Money Mortgage
Purchase Details
Closed on
Nov 21, 2007
Sold by
Stoutt Richard Peter and The Estate Of Venise Stoutt
Bought by
Stoutt Nancy
Create a Home Valuation Report for This Property
The Home Valuation Report is an in-depth analysis detailing your home's value as well as a comparison with similar homes in the area
Home Values in the Area
Average Home Value in this Area
Purchase History
| Date | Buyer | Sale Price | Title Company |
|---|---|---|---|
| Eiben Kendall | -- | None Available | |
| Talley Ronald Eddy | -- | Chicago Title | |
| Federal Home Loan Mortgage Corp | $28,500 | None Available | |
| Egan Wyer Jonathan G | -- | Etc | |
| Stoutt Nancy | -- | None Available |
Source: Public Records
Mortgage History
| Date | Status | Borrower | Loan Amount |
|---|---|---|---|
| Previous Owner | Egan Wyer Jonathan G | $36,250 |
Source: Public Records
Tax History Compared to Growth
Tax History
| Year | Tax Paid | Tax Assessment Tax Assessment Total Assessment is a certain percentage of the fair market value that is determined by local assessors to be the total taxable value of land and additions on the property. | Land | Improvement |
|---|---|---|---|---|
| 2025 | $2,094 | $100,087 | $19,017 | $81,070 |
| 2024 | $2,094 | $100,087 | $19,017 | $81,070 |
| 2023 | $2,094 | $101,676 | $19,318 | $82,358 |
| 2022 | $2,040 | $88,626 | $16,839 | $71,787 |
| 2021 | $1,760 | $75,513 | $14,347 | $61,166 |
| 2020 | $1,753 | $69,503 | $13,206 | $56,297 |
| 2019 | $1,828 | $69,503 | $13,206 | $56,297 |
| 2018 | $1,616 | $63,876 | $12,136 | $51,740 |
| 2017 | $1,679 | $63,876 | $12,136 | $51,740 |
| 2016 | $1,282 | $48,763 | $9,265 | $39,498 |
| 2015 | $799 | $41,192 | $7,826 | $33,366 |
| 2014 | $799 | $31,092 | $5,907 | $25,185 |
Source: Public Records
Map
Nearby Homes
- 5208 Arboles Dr Unit 4
- 5202 Arboles Dr Unit 3
- 5230 Arboles Dr Unit 4
- 11531 Gaymoor Dr
- 5244 Arboles Dr Unit 6
- 11607 Chimney Rock Rd Unit C
- 11609 Chimney Rock Rd Unit B
- 5217 Arboles Dr Unit N
- 11519 Endicott Ln
- 5237 Arboles Dr Unit C
- 11529 Chimney Rock Rd
- 11550 Chimney Rock Unit 400 Rd
- 11550 Chimney Rock Rd Unit 321
- 11550 Chimney Rock Rd Unit 324
- 11525 Burdine St Unit 403
- 11540 Chimney Rock Rd Unit 128
- 11540 Chimney Rock Rd Unit 125
- 5411 Spellman Rd
- 5414 Sanford Rd
- 5602 W Bellfort St
- 5208 Arboles Dr
- 5208 Arboles Dr
- 5208 Arboles Dr
- 5208 Arboles Dr
- 5208 Arboles Dr
- 5208 Arboles Dr
- 5208 Arboles Dr
- 5208 Arboles Dr Unit 12
- 5208 Arboles Dr Unit B1
- 5208 Arboles Dr
- 5208 Arboles Dr Unit C-3
- 5208 Arboles Dr Unit A-1
- 5208 Arboles Dr Unit A3
- 5208 Arboles Dr Unit 3C
- 5208 Arboles Dr Unit A-2
- 5208 Arboles Dr Unit B2
- 5208 Arboles Dr Unit B3
- 5208 Arboles Dr Unit C1
- 5208 Arboles Dr Unit B4
- 5208 Arboles Dr Unit C1