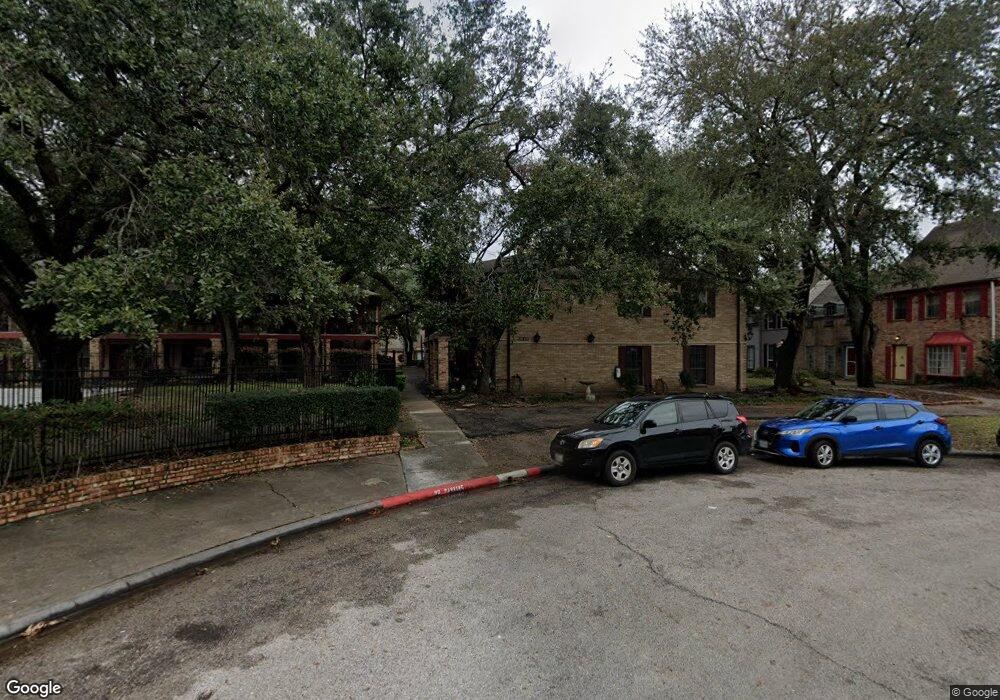
5208 Arboles Dr Unit C1 Houston, TX 77035
Westbury NeighborhoodEstimated Value: $80,000 - $91,000
1
Bed
1
Bath
736
Sq Ft
$118/Sq Ft
Est. Value
About This Home
This home is located at 5208 Arboles Dr Unit C1, Houston, TX 77035 and is currently estimated at $87,098, approximately $118 per square foot. 5208 Arboles Dr Unit C1 is a home located in Harris County with nearby schools including Parker Elementary School, Meyerland Middle, and Westbury High School.
Ownership History
Date
Name
Owned For
Owner Type
Purchase Details
Closed on
Aug 15, 2024
Sold by
Wang Feixue and Corrigan Joseph
Bought by
Xu Na
Current Estimated Value
Purchase Details
Closed on
Jun 8, 2022
Sold by
Ping Yao
Bought by
Wang Feixue
Purchase Details
Closed on
Oct 10, 2006
Sold by
Robinson Earl J and Robinson Gilda
Bought by
Crescentini Richard
Home Financials for this Owner
Home Financials are based on the most recent Mortgage that was taken out on this home.
Original Mortgage
$50,000
Interest Rate
6.44%
Mortgage Type
Purchase Money Mortgage
Purchase Details
Closed on
Jun 16, 2006
Sold by
Robinson Todd R and Robinson Halaine
Bought by
Robinson Earl J and Robinson Gilda
Purchase Details
Closed on
Jan 27, 2004
Sold by
Gilchrist Garland Keith
Bought by
Meza Melissa
Home Financials for this Owner
Home Financials are based on the most recent Mortgage that was taken out on this home.
Original Mortgage
$30,000
Interest Rate
5.79%
Mortgage Type
Purchase Money Mortgage
Create a Home Valuation Report for This Property
The Home Valuation Report is an in-depth analysis detailing your home's value as well as a comparison with similar homes in the area
Home Values in the Area
Average Home Value in this Area
Purchase History
| Date | Buyer | Sale Price | Title Company |
|---|---|---|---|
| Xu Na | -- | None Listed On Document | |
| Wang Feixue | -- | Law Office Of Beard & Lane Pc | |
| Crescentini Richard | -- | Alamo Title Company | |
| Robinson Earl J | -- | None Available | |
| Meza Melissa | -- | First American Title |
Source: Public Records
Mortgage History
| Date | Status | Borrower | Loan Amount |
|---|---|---|---|
| Previous Owner | Crescentini Richard | $50,000 | |
| Previous Owner | Meza Melissa | $30,000 |
Source: Public Records
Tax History Compared to Growth
Tax History
| Year | Tax Paid | Tax Assessment Tax Assessment Total Assessment is a certain percentage of the fair market value that is determined by local assessors to be the total taxable value of land and additions on the property. | Land | Improvement |
|---|---|---|---|---|
| 2025 | $1,971 | $100,087 | $19,017 | $81,070 |
| 2024 | $1,971 | $94,187 | $17,896 | $76,291 |
| 2023 | $1,971 | $101,676 | $19,318 | $82,358 |
| 2022 | $2,040 | $88,626 | $16,839 | $71,787 |
| 2021 | $1,615 | $75,513 | $14,347 | $61,166 |
| 2020 | $1,375 | $54,533 | $10,361 | $44,172 |
| 2019 | $1,317 | $54,533 | $10,361 | $44,172 |
| 2018 | $208 | $48,763 | $9,265 | $39,498 |
| 2017 | $1,088 | $48,763 | $9,265 | $39,498 |
| 2016 | $989 | $48,763 | $9,265 | $39,498 |
| 2015 | $155 | $41,192 | $7,826 | $33,366 |
| 2014 | $155 | $31,092 | $5,907 | $25,185 |
Source: Public Records
Map
Nearby Homes
- 5230 Arboles Dr Unit 4
- 5202 Arboles Dr Unit 3
- 11609 Chimney Rock Rd Unit B
- 11607 Chimney Rock Rd Unit C
- 5244 Arboles Dr Unit 6
- 5208 Arboles Dr Unit 4
- 5217 Arboles Dr Unit N
- 5237 Arboles Dr Unit C
- 11531 Gaymoor Dr
- 11519 Endicott Ln
- 11529 Chimney Rock Rd
- 11550 Chimney Rock Unit 400 Rd
- 11550 Chimney Rock Rd Unit 321
- 11550 Chimney Rock Rd Unit 324
- 11525 Burdine St Unit 403
- 11540 Chimney Rock Rd Unit 128
- 11540 Chimney Rock Rd Unit 125
- 5411 Spellman Rd
- 5414 Sanford Rd
- 5602 W Bellfort St
- 5208 Arboles Dr
- 5208 Arboles Dr
- 5208 Arboles Dr
- 5208 Arboles Dr
- 5208 Arboles Dr
- 5208 Arboles Dr
- 5208 Arboles Dr
- 5208 Arboles Dr Unit 11
- 5208 Arboles Dr Unit 12
- 5208 Arboles Dr Unit B1
- 5208 Arboles Dr
- 5208 Arboles Dr Unit C-3
- 5208 Arboles Dr Unit A-1
- 5208 Arboles Dr Unit A3
- 5208 Arboles Dr Unit 3C
- 5208 Arboles Dr Unit A-2
- 5208 Arboles Dr Unit B2
- 5208 Arboles Dr Unit B3
- 5208 Arboles Dr Unit C1
- 5208 Arboles Dr Unit B4