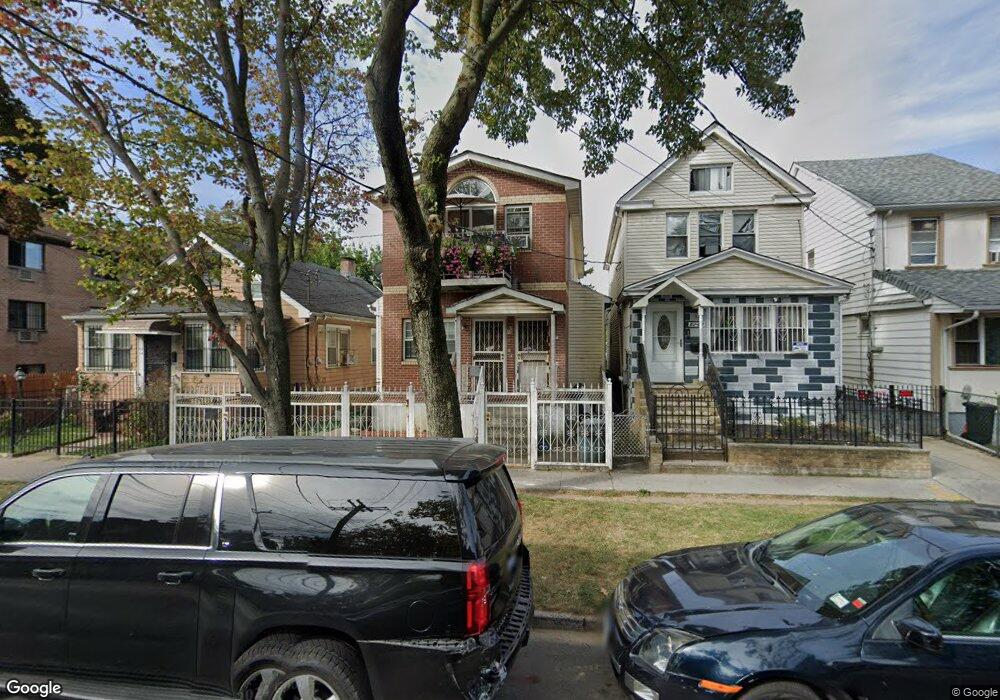
5208 Junction Blvd Elmhurst, NY 11373
Elmhurst NeighborhoodEstimated Value: $818,387 - $1,035,000
Studio
--
Bath
1,225
Sq Ft
$769/Sq Ft
Est. Value
About This Home
This home is located at 5208 Junction Blvd, Elmhurst, NY 11373 and is currently estimated at $942,597, approximately $769 per square foot. 5208 Junction Blvd is a home located in Queens County with nearby schools including P.S. 13 Clement C Moore, I.S. 093 Ridgewood, and Joseph F. Quinn Intermediate School 77.
Ownership History
Date
Name
Owned For
Owner Type
Purchase Details
Closed on
Jun 30, 2006
Sold by
Khanam Laizu
Bought by
Yascaribay Manuel
Current Estimated Value
Home Financials for this Owner
Home Financials are based on the most recent Mortgage that was taken out on this home.
Original Mortgage
$99,000
Outstanding Balance
$58,659
Interest Rate
6.71%
Estimated Equity
$883,938
Purchase Details
Closed on
May 25, 2005
Sold by
Liang Jar Ben and Tan Yan Cui
Bought by
Khanam Laizu
Home Financials for this Owner
Home Financials are based on the most recent Mortgage that was taken out on this home.
Original Mortgage
$139,100
Interest Rate
5.79%
Purchase Details
Closed on
Aug 16, 2000
Sold by
Li Shao Hui and Li Chia Luan
Bought by
Liang Jar Ben and Tan Yan Cui
Home Financials for this Owner
Home Financials are based on the most recent Mortgage that was taken out on this home.
Original Mortgage
$176,000
Interest Rate
8.07%
Create a Home Valuation Report for This Property
The Home Valuation Report is an in-depth analysis detailing your home's value as well as a comparison with similar homes in the area
Home Values in the Area
Average Home Value in this Area
Purchase History
| Date | Buyer | Sale Price | Title Company |
|---|---|---|---|
| Yascaribay Manuel | $660,000 | -- | |
| Yascaribay Manuel | $660,000 | -- | |
| Khanam Laizu | $525,000 | -- | |
| Khanam Laizu | $525,000 | -- | |
| Liang Jar Ben | $220,000 | -- | |
| Liang Jar Ben | $220,000 | -- |
Source: Public Records
Mortgage History
| Date | Status | Borrower | Loan Amount |
|---|---|---|---|
| Open | Yascaribay Manuel | $99,000 | |
| Closed | Yascaribay Manuel | $99,000 | |
| Open | Yascaribay Manuel | $528,000 | |
| Closed | Yascaribay Manuel | $528,000 | |
| Previous Owner | Khanam Laizu | $139,100 | |
| Previous Owner | Khanam Laizu | $359,650 | |
| Previous Owner | Liang Jar Ben | $176,000 |
Source: Public Records
Tax History
| Year | Tax Paid | Tax Assessment Tax Assessment Total Assessment is a certain percentage of the fair market value that is determined by local assessors to be the total taxable value of land and additions on the property. | Land | Improvement |
|---|---|---|---|---|
| 2025 | $5,677 | $31,420 | $8,903 | $22,517 |
| 2024 | $5,689 | $29,665 | $7,991 | $21,674 |
| 2023 | $5,418 | $28,373 | $6,796 | $21,577 |
| 2022 | $5,120 | $55,800 | $14,400 | $41,400 |
| 2021 | $5,404 | $51,540 | $14,400 | $37,140 |
| 2020 | $5,246 | $55,620 | $14,400 | $41,220 |
| 2019 | $4,879 | $51,060 | $14,400 | $36,660 |
| 2018 | $4,522 | $23,644 | $7,040 | $16,604 |
| 2017 | $4,302 | $22,572 | $7,223 | $15,349 |
| 2016 | $4,203 | $22,572 | $7,223 | $15,349 |
| 2015 | $2,349 | $21,819 | $10,329 | $11,490 |
| 2014 | $2,349 | $20,601 | $11,703 | $8,898 |
Source: Public Records
Map
Nearby Homes
- 9414 51st Ave
- 51-02 Junction Blvd
- 94-28 53rd Ave
- 9235 51st Ave
- 93-10 50th Ave
- 94-14 Corona Ave
- 92-38 55th Ave
- 9052 52nd Ave
- 54-08 92nd St
- 4808 92nd St
- 91-02 50th Ave
- 90-40 54th Ave
- 92-30 56th Ave Unit 5F
- 90-23 54th Ave
- 94-44 45th Ave
- 9059 56th Ave Unit 2G
- 94-68 45th Ave
- 97-40 Corona Ave
- 94-66 45th Ave
- 92-31 57th Ave Unit 2J
- 5210 Junction Blvd
- 52-10 Junction Blvd
- 5214 Junction Blvd
- 5206 Junction Blvd
- 52-06 Junction Blvd
- 5204 Junction Blvd
- 9432 52nd Ave
- 52-02 Junction Blvd
- 9433 53rd Ave
- 9431 53rd Ave
- 9435 53rd Ave
- 9435 53rd Ave Unit 1Fl
- 9427 53rd Ave
- 9430 52nd Ave
- 5202 Junction Blvd
- 9430 52nd Ave
- 9428 52nd Ave
- 9435 53rd Ave Unit 3 Fl
- 9435 53rd Ave Unit 2 Fl
- 9435 53rd Ave Unit 1 Fl
Your Personal Tour Guide
Ask me questions while you tour the home.