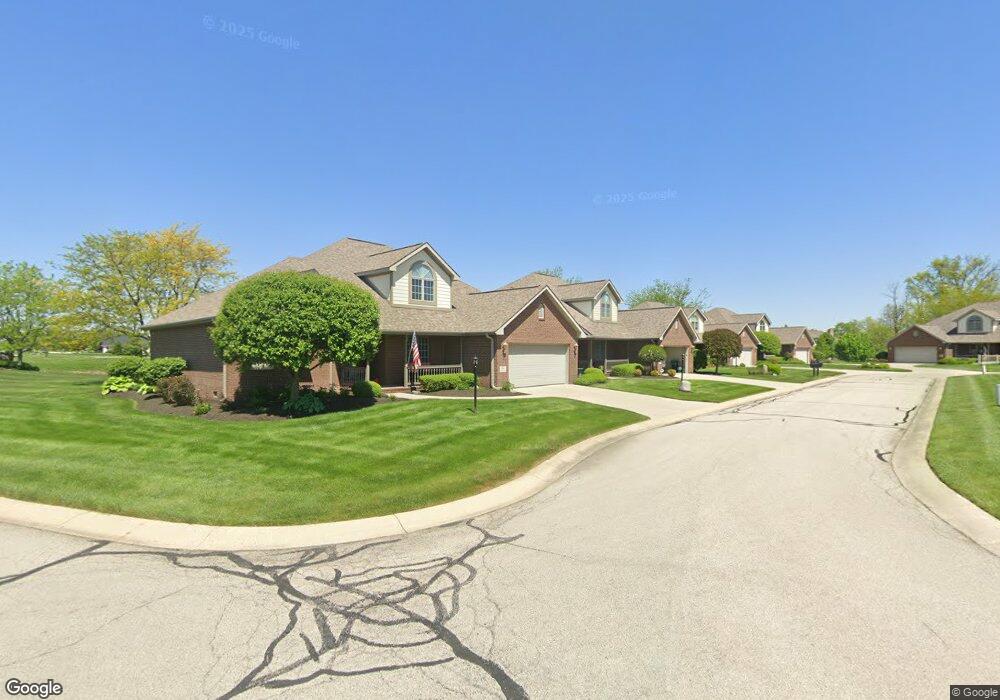
5208 W Stonebridge Dr Muncie, IN 47304
Estimated Value: $366,000 - $428,000
--
Bed
2
Baths
3,013
Sq Ft
$132/Sq Ft
Est. Value
About This Home
This home is located at 5208 W Stonebridge Dr, Muncie, IN 47304 and is currently estimated at $397,394, approximately $131 per square foot. 5208 W Stonebridge Dr is a home located in Delaware County with nearby schools including Wes-Del Elementary School and Wes-Del Middle/Senior High School.
Ownership History
Date
Name
Owned For
Owner Type
Purchase Details
Closed on
Nov 13, 2024
Sold by
Arnold Tiffany Janney
Bought by
Arnold Thomas F and Arnold Tiffany Janney
Current Estimated Value
Purchase Details
Closed on
Apr 4, 2018
Sold by
Janney Elaine B
Bought by
Arnold Thomas F and Arnold Tiffany J
Purchase Details
Closed on
May 21, 2013
Sold by
Janney William T and Janney Elaine B
Bought by
Janney Elaine B
Purchase Details
Closed on
Sep 30, 2005
Sold by
Eagle Branch Construction Llc
Bought by
Janney William T and Janney Elaine B
Home Financials for this Owner
Home Financials are based on the most recent Mortgage that was taken out on this home.
Original Mortgage
$231,647
Interest Rate
8.25%
Mortgage Type
Adjustable Rate Mortgage/ARM
Create a Home Valuation Report for This Property
The Home Valuation Report is an in-depth analysis detailing your home's value as well as a comparison with similar homes in the area
Home Values in the Area
Average Home Value in this Area
Purchase History
| Date | Buyer | Sale Price | Title Company |
|---|---|---|---|
| Arnold Thomas F | -- | None Listed On Document | |
| Janney Arnold Tiffany | -- | None Listed On Document | |
| Arnold Thomas F | -- | None Listed On Document | |
| Janney Arnold Tiffany | -- | None Listed On Document | |
| Arnold Thomas F | -- | -- | |
| Janney Elaine B | -- | -- | |
| Janney William T | -- | None Available |
Source: Public Records
Mortgage History
| Date | Status | Borrower | Loan Amount |
|---|---|---|---|
| Previous Owner | Janney William T | $231,647 |
Source: Public Records
Tax History Compared to Growth
Tax History
| Year | Tax Paid | Tax Assessment Tax Assessment Total Assessment is a certain percentage of the fair market value that is determined by local assessors to be the total taxable value of land and additions on the property. | Land | Improvement |
|---|---|---|---|---|
| 2024 | $2,833 | $271,500 | $40,000 | $231,500 |
| 2023 | $2,861 | $274,300 | $40,000 | $234,300 |
| 2022 | $2,916 | $279,800 | $40,000 | $239,800 |
| 2021 | $2,726 | $260,800 | $40,000 | $220,800 |
| 2020 | $2,752 | $263,400 | $40,000 | $223,400 |
| 2019 | $2,768 | $265,000 | $40,000 | $225,000 |
| 2018 | $2,793 | $267,500 | $40,000 | $227,500 |
| 2017 | $2,794 | $267,600 | $40,000 | $227,600 |
| 2016 | $3,023 | $290,500 | $40,000 | $250,500 |
| 2014 | $2,958 | $290,500 | $40,000 | $250,500 |
| 2013 | -- | $290,500 | $40,000 | $250,500 |
Source: Public Records
Map
Nearby Homes
- 5210 W Stone Bridge Dr
- 5212 W Shoreline Terrace
- 5321 W Co Road 350 N
- 5512 N Red Cedar
- 5445 W Co Road 350 N
- 5445 W County Road 350 N
- 5415 W Co Road 350 N
- 4110 W Heath Dr
- 0 N Moore Rd Unit 202532976
- 5109 N Leslie Dr
- 6328 W Bethel Ave
- 0 N Morrison Rd
- 3708 W Allen Ct
- 3400 W Riggin Rd Unit 48
- 3400 W Riggin Rd Unit 6
- 3400 W Riggin Rd
- 4808 N Camelot Dr
- Lot 2 Sawmill Ct
- Lot 41 Milkhouse Ln
- Lot 58 Sawmill Ln
- 5210 W Stonebridge Dr
- 4909 Greystone Dr
- 4913 Greystone Dr
- 5205 Stonebridge Dr
- 5001 N Eagle Branch Dr
- 5203 Stonebridge Dr
- 5003 N Eagle Branch Dr
- 5007 N Eagle Branch Dr
- 5007 N Eagle Branch Dr Unit Muncie
- 5009 N Eagle Branch Dr
- LOT 1 Eagle Branch
- 0 N Eagle Branch
- 5301 W Shoreline Terrace
- 0 W Shoreline Terrace Unit 20078547
- 0 W Shoreline Terrace Unit 21423880
- Lot #1 W Shorline Terrace
- 5209 W Shoreline Terrace
- 5010 N Eagle Branch Dr
- 5008 N Eagle Branch Dr
- 5002 N Eagle Branch Dr