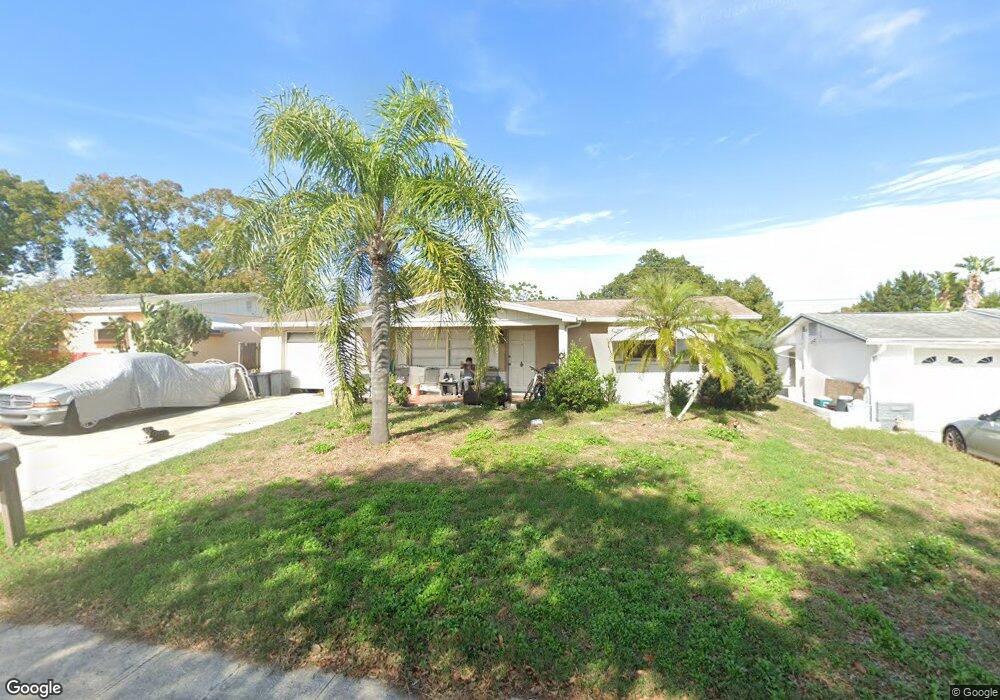
5209 Reseda Dr New Port Richey, FL 34652
Estimated Value: $199,217 - $279,000
2
Beds
2
Baths
1,248
Sq Ft
$185/Sq Ft
Est. Value
About This Home
This home is located at 5209 Reseda Dr, New Port Richey, FL 34652 and is currently estimated at $230,804, approximately $184 per square foot. 5209 Reseda Dr is a home located in Pasco County with nearby schools including Anclote Elementary School, Gulf Middle School, and Gulf High School.
Ownership History
Date
Name
Owned For
Owner Type
Purchase Details
Closed on
Sep 7, 2017
Sold by
Weaver Flora and Weaver Lester L
Bought by
Hunt Robert
Current Estimated Value
Purchase Details
Closed on
Oct 4, 2000
Sold by
Furnish David A and Furnish Vonna
Bought by
Weaver Lester L and Weaver Flora
Home Financials for this Owner
Home Financials are based on the most recent Mortgage that was taken out on this home.
Original Mortgage
$50,240
Interest Rate
7.97%
Mortgage Type
New Conventional
Purchase Details
Closed on
Aug 7, 2000
Sold by
Scott Florence and Werth Joan
Bought by
Furnish David A and Furnish Vonna E
Home Financials for this Owner
Home Financials are based on the most recent Mortgage that was taken out on this home.
Original Mortgage
$50,240
Interest Rate
7.97%
Mortgage Type
New Conventional
Purchase Details
Closed on
Aug 23, 1996
Sold by
Scott Joseph J
Bought by
Scott Florence and Werth Joan
Create a Home Valuation Report for This Property
The Home Valuation Report is an in-depth analysis detailing your home's value as well as a comparison with similar homes in the area
Home Values in the Area
Average Home Value in this Area
Purchase History
| Date | Buyer | Sale Price | Title Company |
|---|---|---|---|
| Hunt Robert | $60,000 | Ark Title Services Llc | |
| Weaver Lester L | $62,800 | -- | |
| Furnish David A | $61,000 | -- | |
| Scott Florence | $100 | -- |
Source: Public Records
Mortgage History
| Date | Status | Borrower | Loan Amount |
|---|---|---|---|
| Previous Owner | Scott Florence | $52,000 | |
| Previous Owner | Scott Florence | $50,240 |
Source: Public Records
Tax History Compared to Growth
Tax History
| Year | Tax Paid | Tax Assessment Tax Assessment Total Assessment is a certain percentage of the fair market value that is determined by local assessors to be the total taxable value of land and additions on the property. | Land | Improvement |
|---|---|---|---|---|
| 2025 | $2,654 | $166,288 | $33,966 | $132,322 |
| 2024 | $2,654 | $175,268 | $31,824 | $143,444 |
| 2023 | $2,476 | $112,570 | $0 | $0 |
| 2022 | $1,940 | $123,750 | $21,216 | $102,534 |
| 2021 | $1,774 | $107,212 | $16,830 | $90,382 |
| 2020 | $1,559 | $84,589 | $10,863 | $73,726 |
| 2019 | $1,511 | $84,870 | $10,863 | $74,007 |
| 2018 | $1,356 | $71,727 | $10,863 | $60,864 |
| 2017 | $486 | $44,060 | $0 | $0 |
| 2016 | $435 | $42,266 | $0 | $0 |
| 2015 | $436 | $41,972 | $0 | $0 |
| 2014 | $415 | $41,639 | $10,200 | $31,439 |
Source: Public Records
Map
Nearby Homes
- 5200 Dove Dr
- 3547 Morley Dr
- 5122 Dove Dr
- 5120 Cicero Dr
- 3645 Galway Dr
- 3522 Cambridge St
- 3420 Lanark Dr
- 0 Grand Blvd
- 3348 Lanark Dr
- 3342 Lanark Dr
- 5543 Moog Rd
- 3415 Chatford Dr
- 3346 Chatford Dr
- 4906 Uranus Ave
- 5608 Perkin Dr
- 3317 Hampshire Dr
- 3244 Hampshire Dr
- 5621 Moog Rd
- 3207 Jarvis St
- 4819 Beacon Hill Dr