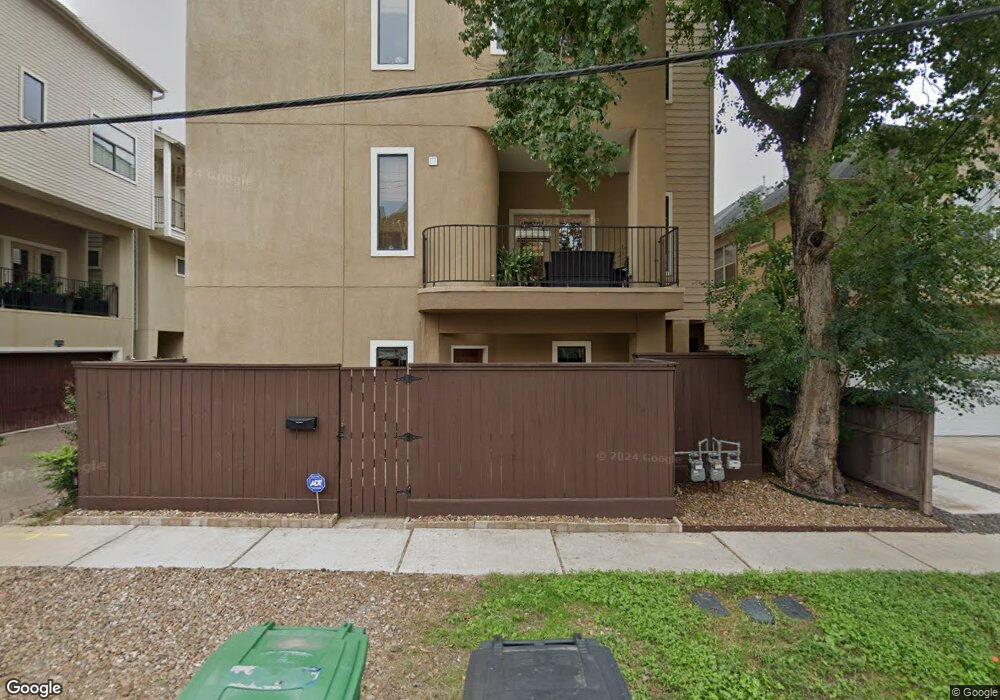
5209 Schuler St Unit C Houston, TX 77007
Washington Avenue Coalition NeighborhoodEstimated Value: $447,068 - $464,000
3
Beds
4
Baths
2,290
Sq Ft
$199/Sq Ft
Est. Value
About This Home
This home is located at 5209 Schuler St Unit C, Houston, TX 77007 and is currently estimated at $456,767, approximately $199 per square foot. 5209 Schuler St Unit C is a home located in Harris County with nearby schools including Memorial Elementary School, Hogg Middle, and Lamar High School.
Ownership History
Date
Name
Owned For
Owner Type
Purchase Details
Closed on
Apr 10, 2017
Sold by
Willis David P
Bought by
Chase Thomas W
Current Estimated Value
Home Financials for this Owner
Home Financials are based on the most recent Mortgage that was taken out on this home.
Original Mortgage
$295,600
Outstanding Balance
$245,239
Interest Rate
4.1%
Mortgage Type
Stand Alone First
Estimated Equity
$211,528
Purchase Details
Closed on
Jul 9, 2012
Sold by
Howrd Jeff L
Bought by
Willis David P
Purchase Details
Closed on
May 28, 2010
Sold by
Chavez Noe
Bought by
Howard Jeff L
Purchase Details
Closed on
May 26, 2010
Sold by
Fannie Mae
Bought by
Chavez Noe
Purchase Details
Closed on
Jun 2, 2009
Sold by
Chavez Noe
Bought by
Federal National Mortgage Association
Create a Home Valuation Report for This Property
The Home Valuation Report is an in-depth analysis detailing your home's value as well as a comparison with similar homes in the area
Home Values in the Area
Average Home Value in this Area
Purchase History
| Date | Buyer | Sale Price | Title Company |
|---|---|---|---|
| Chase Thomas W | -- | Stewart Title | |
| Willis David P | -- | None Available | |
| Howard Jeff L | -- | Fidelity National Title | |
| Chavez Noe | -- | Fidelity National Title | |
| Federal National Mortgage Association | $375,342 | None Available |
Source: Public Records
Mortgage History
| Date | Status | Borrower | Loan Amount |
|---|---|---|---|
| Open | Chase Thomas W | $295,600 |
Source: Public Records
Tax History Compared to Growth
Tax History
| Year | Tax Paid | Tax Assessment Tax Assessment Total Assessment is a certain percentage of the fair market value that is determined by local assessors to be the total taxable value of land and additions on the property. | Land | Improvement |
|---|---|---|---|---|
| 2025 | $6,023 | $432,958 | $190,376 | $242,582 |
| 2024 | $6,023 | $410,973 | $190,376 | $220,597 |
| 2023 | $6,023 | $414,960 | $190,376 | $224,584 |
| 2022 | $8,183 | $371,640 | $190,376 | $181,264 |
| 2021 | $8,661 | $371,607 | $190,376 | $181,231 |
| 2020 | $8,811 | $363,849 | $190,376 | $173,473 |
| 2019 | $9,130 | $360,803 | $190,376 | $170,427 |
| 2018 | $6,873 | $352,682 | $134,383 | $218,299 |
| 2017 | $9,585 | $379,058 | $134,383 | $244,675 |
| 2016 | $9,585 | $379,058 | $134,383 | $244,675 |
| 2015 | $9,247 | $379,058 | $134,383 | $244,675 |
| 2014 | $9,247 | $359,701 | $134,383 | $225,318 |
Source: Public Records
Map
Nearby Homes
- 5219 Schuler St
- 5117 Schuler St Unit B
- 5224 Nett St Unit A
- 1320 Studer St
- 5209 Allen St Unit C
- 1318 Reinerman St
- 1317 Roy St
- 1203 Studer St
- 5101 Allen St
- 1109 Studer St
- 1010 Studer St
- 5307 Nett St Unit C
- 918 Lester St
- 4408 Allen St
- 906 Reinerman St
- 5122 Lillian St
- 1205 Detering St
- 1323 Studer St
- 5223 Eigel St
- 5219 Lillian St
- 5209 Schuler St Unit B
- 5209 Schuler St Unit D
- 5209 Schuler St Unit F
- 5209 Schuler St Unit E
- 5209 Schuler St Unit A
- 5209 Schuler St
- 5215 Schuler St
- 5215 Schuler St Unit 1
- 5204 Nett St
- 5204 Nett St
- 5204 Nett St
- 5204 Nett St Unit B
- 5204 Nett St Unit C
- 5204 Nett St Unit A
- 5212 Nett St
- 5206 Nett St
- 5206 Nett St Unit B
- 5206 Nett St
- 5206 Nett St Unit C
- 5206 Nett St Unit A