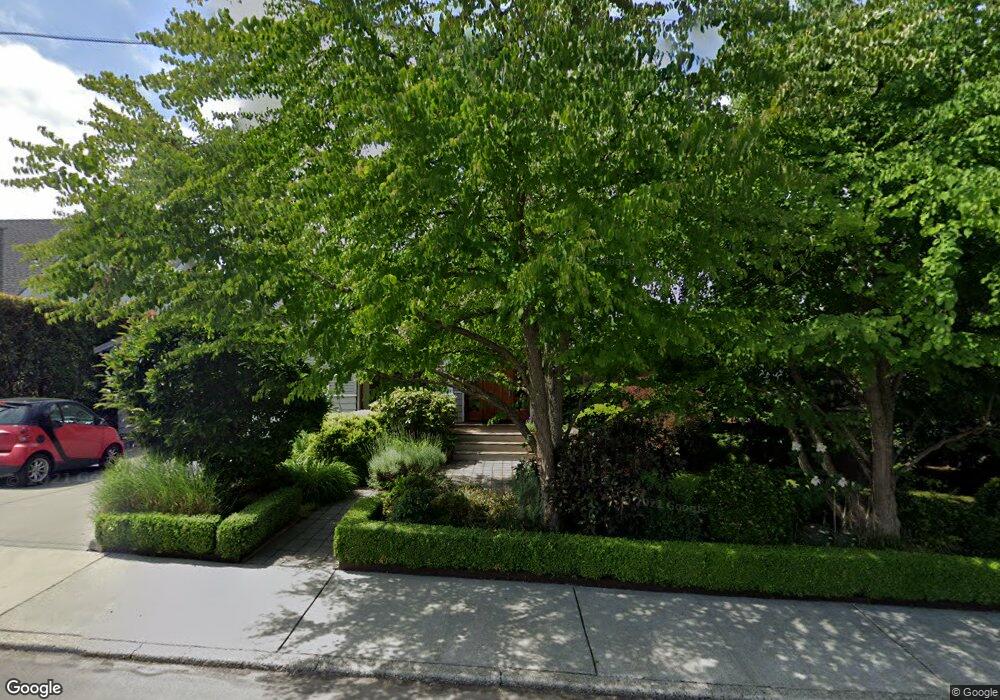
521 11th Ave W Kirkland, WA 98033
Market NeighborhoodEstimated Value: $2,645,000 - $3,628,618
3
Beds
4
Baths
3,450
Sq Ft
$948/Sq Ft
Est. Value
About This Home
This home is located at 521 11th Ave W, Kirkland, WA 98033 and is currently estimated at $3,270,155, approximately $947 per square foot. 521 11th Ave W is a home located in King County with nearby schools including Peter Kirk Elementary School, Kirkland Middle School, and Lake Washington High School.
Ownership History
Date
Name
Owned For
Owner Type
Purchase Details
Closed on
Dec 13, 2023
Sold by
Gallee Family Revocable Trust
Bought by
Gallee Community Trust and Peschel-Gallee
Current Estimated Value
Purchase Details
Closed on
Jan 22, 2007
Sold by
Peschel Gallee Frank V and Gallee Caroline
Bought by
Peschel Gallee Frank and Gallee Caroline
Purchase Details
Closed on
Feb 21, 2006
Sold by
Jones William G and Jones Ann T
Bought by
Peschel-Gallee Frank and Gallee Caroline
Purchase Details
Closed on
May 2, 1997
Sold by
Zeiler Randall L and Zeiler Gaerda N
Bought by
Jones William G and Jones Ann T
Home Financials for this Owner
Home Financials are based on the most recent Mortgage that was taken out on this home.
Original Mortgage
$189,000
Interest Rate
7.68%
Create a Home Valuation Report for This Property
The Home Valuation Report is an in-depth analysis detailing your home's value as well as a comparison with similar homes in the area
Home Values in the Area
Average Home Value in this Area
Purchase History
| Date | Buyer | Sale Price | Title Company |
|---|---|---|---|
| Gallee Community Trust | $313 | None Listed On Document | |
| Peschel Gallee Frank | -- | None Available | |
| Peschel-Gallee Frank | $1,215,000 | Pacific Nw Tit | |
| Jones William G | $589,000 | Evergreen Title Company Inc |
Source: Public Records
Mortgage History
| Date | Status | Borrower | Loan Amount |
|---|---|---|---|
| Previous Owner | Jones William G | $189,000 |
Source: Public Records
Tax History Compared to Growth
Tax History
| Year | Tax Paid | Tax Assessment Tax Assessment Total Assessment is a certain percentage of the fair market value that is determined by local assessors to be the total taxable value of land and additions on the property. | Land | Improvement |
|---|---|---|---|---|
| 2024 | $23,270 | $2,893,000 | $1,972,000 | $921,000 |
| 2023 | $22,468 | $2,649,000 | $1,806,000 | $843,000 |
| 2022 | $20,135 | $3,194,000 | $2,182,000 | $1,012,000 |
| 2021 | $18,338 | $2,282,000 | $1,539,000 | $743,000 |
| 2020 | $18,104 | $1,910,000 | $1,322,000 | $588,000 |
| 2018 | $17,030 | $1,866,000 | $1,295,000 | $571,000 |
| 2017 | $14,346 | $1,694,000 | $1,162,000 | $532,000 |
| 2016 | $13,797 | $1,488,000 | $1,033,000 | $455,000 |
| 2015 | $11,464 | $1,413,000 | $967,000 | $446,000 |
| 2014 | -- | $1,128,000 | $800,000 | $328,000 |
| 2013 | -- | $928,000 | $728,000 | $200,000 |
Source: Public Records
Map
Nearby Homes
- 435 8th Ave W
- 421 14th Ave W
- 421 14th Ave W Unit B
- 1006 4th St W
- 1240 4th St W
- 1223 1st St
- 1710 1st St
- 235 10th Ave W
- 116 12th Ave
- 7 10th Ave
- 1812 7th St W
- 215 8th Ave W
- Residence 3 Plan at Market West
- 122 10th Ave
- 1838 Market St
- 1416 2nd St
- 1844 Market St Unit 2
- 112 18th Ave
- 1433 10th St W
- 212 5th Ave W