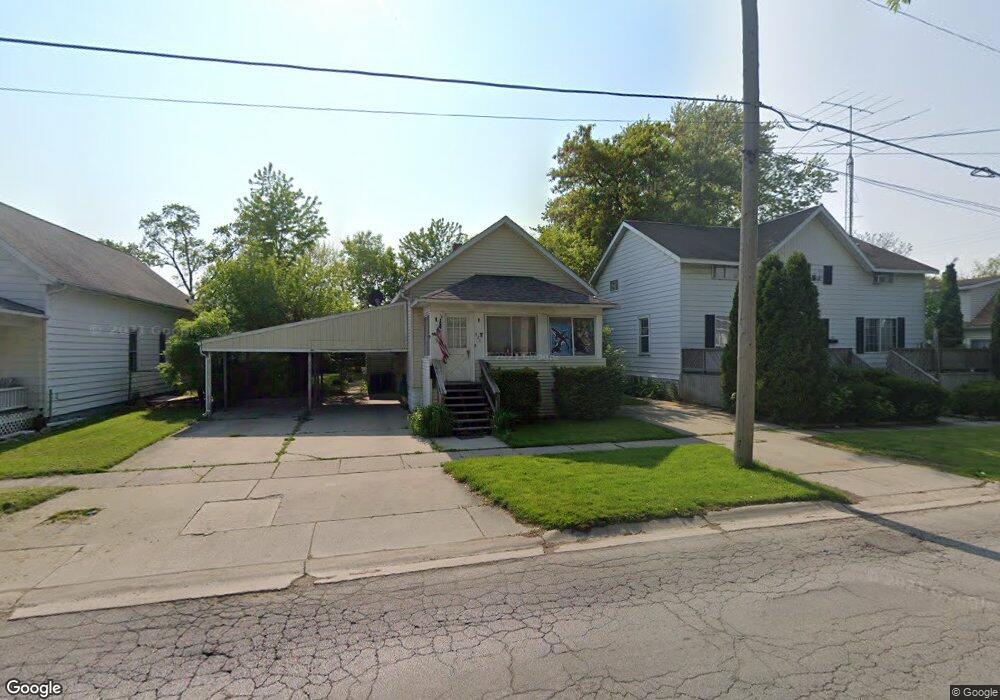
521 13th St Port Huron, MI 48060
Estimated Value: $84,000 - $124,000
2
Beds
1
Bath
900
Sq Ft
$110/Sq Ft
Est. Value
About This Home
This home is located at 521 13th St, Port Huron, MI 48060 and is currently estimated at $98,890, approximately $109 per square foot. 521 13th St is a home located in St. Clair County with nearby schools including Michigamme Elementary School, Holland Woods Middle School, and Port Huron High School.
Ownership History
Date
Name
Owned For
Owner Type
Purchase Details
Closed on
Sep 30, 2009
Sold by
Jt Bauer Holdings Llc
Bought by
Assett Link Llc
Current Estimated Value
Purchase Details
Closed on
Nov 18, 2005
Sold by
Michigan State Housing Development Autho
Bought by
Jt Bauer Holdings Llc
Purchase Details
Closed on
Feb 25, 2005
Sold by
Heather James and Heather Tammy J
Bought by
Michigan State Housing Development Au
Create a Home Valuation Report for This Property
The Home Valuation Report is an in-depth analysis detailing your home's value as well as a comparison with similar homes in the area
Home Values in the Area
Average Home Value in this Area
Purchase History
| Date | Buyer | Sale Price | Title Company |
|---|---|---|---|
| Assett Link Llc | -- | None Available | |
| Jt Bauer Holdings Llc | -- | None Available | |
| Michigan State Housing Development Au | $69,786 | None Available |
Source: Public Records
Tax History Compared to Growth
Tax History
| Year | Tax Paid | Tax Assessment Tax Assessment Total Assessment is a certain percentage of the fair market value that is determined by local assessors to be the total taxable value of land and additions on the property. | Land | Improvement |
|---|---|---|---|---|
| 2025 | $1,207 | $36,700 | $0 | $0 |
| 2024 | $996 | $33,200 | $0 | $0 |
| 2023 | $943 | $28,900 | $0 | $0 |
| 2022 | $881 | $24,400 | $0 | $0 |
| 2021 | $842 | $21,800 | $0 | $0 |
| 2020 | $845 | $20,500 | $20,500 | $0 |
| 2019 | $830 | $14,100 | $0 | $0 |
| 2018 | $812 | $14,100 | $0 | $0 |
| 2017 | $746 | $12,100 | $0 | $0 |
| 2016 | $652 | $12,100 | $0 | $0 |
| 2015 | $700 | $12,500 | $12,500 | $0 |
| 2014 | $700 | $13,000 | $13,000 | $0 |
| 2013 | -- | $13,000 | $0 | $0 |
Source: Public Records
Map
Nearby Homes