Estimated Value: $183,428 - $271,000
3
Beds
2
Baths
1,928
Sq Ft
$116/Sq Ft
Est. Value
About This Home
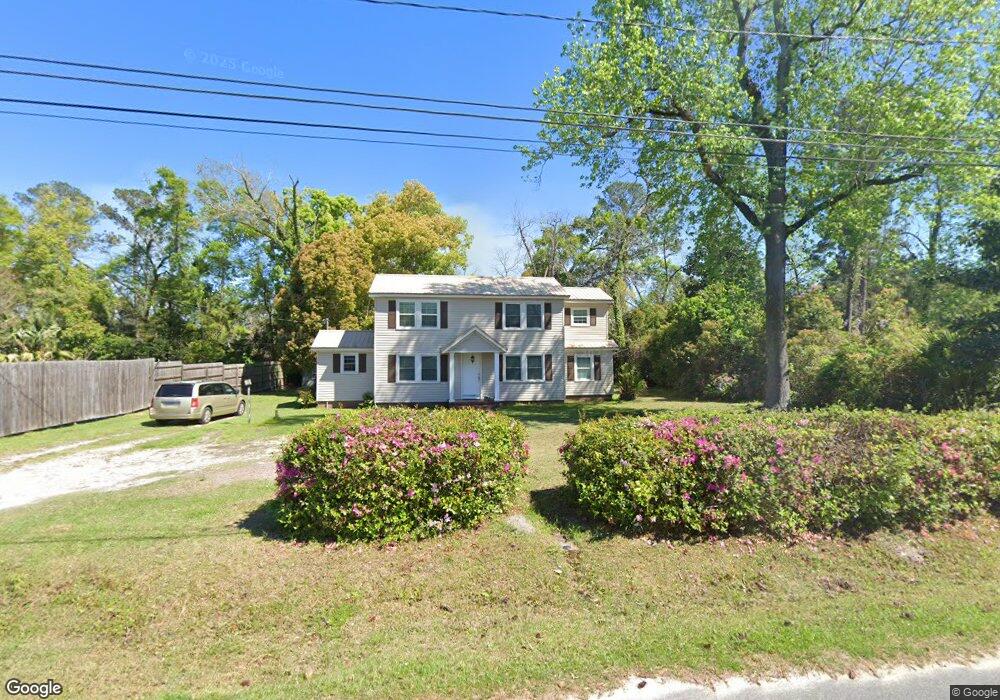
This home is located at 521 1st St SE Unit 1, Cairo, GA 39828 and is currently estimated at $223,857, approximately $116 per square foot. 521 1st St SE Unit 1 is a home located in Grady County with nearby schools including Cairo High School.
Ownership History
Date
Name
Owned For
Owner Type
Purchase Details
Closed on
Apr 22, 2010
Sold by
Jeffery Jefery J
Bought by
Maxwell Elliott and Maxwell Emily
Current Estimated Value
Home Financials for this Owner
Home Financials are based on the most recent Mortgage that was taken out on this home.
Original Mortgage
$122,735
Outstanding Balance
$80,727
Interest Rate
4.75%
Mortgage Type
FHA
Estimated Equity
$143,130
Purchase Details
Closed on
Jun 1, 2009
Sold by
Deutsche Bank National Trust Company
Bought by
Jeffery Jeffry J
Purchase Details
Closed on
Apr 9, 2008
Sold by
Holland Deborah E
Bought by
Deutshe Bank National
Purchase Details
Closed on
Sep 15, 2005
Sold by
Mcdougal Jason A
Bought by
Holland Deborah E
Home Financials for this Owner
Home Financials are based on the most recent Mortgage that was taken out on this home.
Original Mortgage
$81,600
Interest Rate
9.69%
Mortgage Type
New Conventional
Purchase Details
Closed on
Apr 14, 2004
Sold by
Avery Ronnie L
Bought by
Mcdougal Jason A
Purchase Details
Closed on
Dec 28, 1988
Bought by
Avery Ronnie L
Create a Home Valuation Report for This Property
The Home Valuation Report is an in-depth analysis detailing your home's value as well as a comparison with similar homes in the area
Home Values in the Area
Average Home Value in this Area
Purchase History
| Date | Buyer | Sale Price | Title Company |
|---|---|---|---|
| Maxwell Elliott | $125,000 | -- | |
| Jeffery Jeffry J | $24,900 | -- | |
| Deutshe Bank National | $66,900 | -- | |
| Holland Deborah E | $81,600 | -- | |
| Mcdougal Jason A | $68,000 | -- | |
| Avery Ronnie L | $49,800 | -- |
Source: Public Records
Mortgage History
| Date | Status | Borrower | Loan Amount |
|---|---|---|---|
| Open | Maxwell Elliott | $122,735 | |
| Previous Owner | Holland Deborah E | $81,600 |
Source: Public Records
Tax History Compared to Growth
Tax History
| Year | Tax Paid | Tax Assessment Tax Assessment Total Assessment is a certain percentage of the fair market value that is determined by local assessors to be the total taxable value of land and additions on the property. | Land | Improvement |
|---|---|---|---|---|
| 2024 | $2,953 | $74,852 | $2,460 | $72,392 |
| 2023 | $1,348 | $36,411 | $3,960 | $32,451 |
| 2022 | $1,402 | $36,411 | $3,960 | $32,451 |
| 2021 | $1,406 | $36,411 | $3,960 | $32,451 |
| 2020 | $1,409 | $36,411 | $3,960 | $32,451 |
| 2019 | $1,409 | $36,411 | $3,960 | $32,451 |
| 2018 | $1,340 | $36,411 | $3,960 | $32,451 |
| 2017 | $1,288 | $36,411 | $3,960 | $32,451 |
| 2016 | $1,144 | $31,608 | $3,960 | $27,648 |
| 2015 | $1,132 | $31,608 | $3,960 | $27,648 |
| 2014 | $1,132 | $31,608 | $3,960 | $27,648 |
| 2013 | -- | $30,088 | $3,960 | $26,128 |
Source: Public Records
Map
Nearby Homes
- 000 S Broad St
- 27 6th Ave SW
- 40 5th Ave SW
- 602 4th St SE
- 309 3rd St SE
- 000 Hwy 111 South 20 59 Acres
- 481 4th St SE
- 471 4th St SE
- 720 1st St SW
- 460 2nd St SW
- 530 6th Ave SE
- 112 Pine Cir SW
- 270 Muggridge Ln
- X 1st St
- 00 Hwy 111 South Tract 1
- 316,322 NW 1st St + Lot
- 0 1st St
- 117 Pine Cir SW
- 1193 S Broad St
- 109 Oriac Ave SW