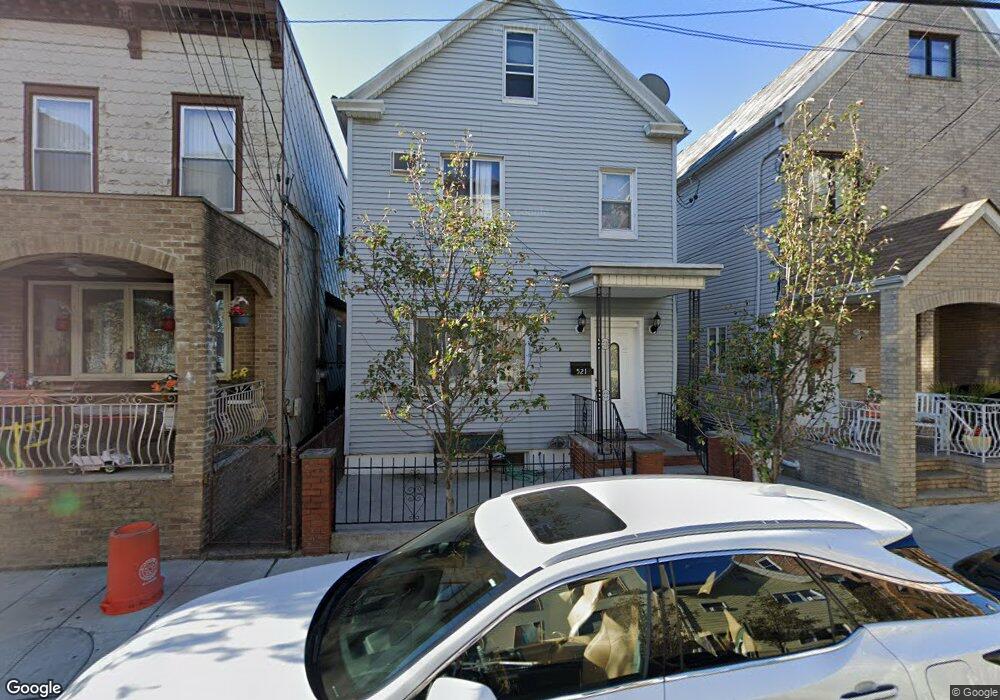
521 28th St Unit 2 Union City, NJ 07087
Estimated Value: $559,415 - $585,000
1
Bed
1
Bath
500
Sq Ft
$1,147/Sq Ft
Est. Value
About This Home
This home is located at 521 28th St Unit 2, Union City, NJ 07087 and is currently estimated at $573,604, approximately $1,147 per square foot. 521 28th St Unit 2 is a home located in Hudson County with nearby schools including Robert Waters School, Sara M. Gilmore Academy, and Jose Marti Freshman Academy.
Ownership History
Date
Name
Owned For
Owner Type
Purchase Details
Closed on
Oct 11, 2017
Sold by
Perez Efren Luis and Perez Zida
Bought by
Perez Jorben and Perez Ivonne
Current Estimated Value
Home Financials for this Owner
Home Financials are based on the most recent Mortgage that was taken out on this home.
Original Mortgage
$333,841
Outstanding Balance
$278,851
Interest Rate
3.82%
Mortgage Type
FHA
Estimated Equity
$294,753
Purchase Details
Closed on
Jan 6, 2017
Sold by
Perez Luis and Perez Efren Luis
Bought by
Perez Efren Luis and Perez Zida
Purchase Details
Closed on
Jan 3, 2017
Sold by
Rodriguez Adelmo and Rodriguez Alicia
Bought by
Perez Luis
Create a Home Valuation Report for This Property
The Home Valuation Report is an in-depth analysis detailing your home's value as well as a comparison with similar homes in the area
Home Values in the Area
Average Home Value in this Area
Purchase History
| Date | Buyer | Sale Price | Title Company |
|---|---|---|---|
| Perez Jorben | $340,000 | Allied Title Llc | |
| Perez Efren Luis | -- | Allied Title Llc | |
| Perez Luis | $253,000 | None Available |
Source: Public Records
Mortgage History
| Date | Status | Borrower | Loan Amount |
|---|---|---|---|
| Open | Perez Jorben | $333,841 |
Source: Public Records
Tax History Compared to Growth
Tax History
| Year | Tax Paid | Tax Assessment Tax Assessment Total Assessment is a certain percentage of the fair market value that is determined by local assessors to be the total taxable value of land and additions on the property. | Land | Improvement |
|---|---|---|---|---|
| 2025 | $8,431 | $466,700 | $267,800 | $198,900 |
| 2024 | $9,802 | $456,200 | $261,000 | $195,200 |
| 2023 | $9,802 | $127,500 | $75,000 | $52,500 |
| 2022 | $9,449 | $127,500 | $75,000 | $52,500 |
| 2021 | $9,416 | $127,500 | $75,000 | $52,500 |
| 2020 | $9,309 | $127,500 | $75,000 | $52,500 |
| 2019 | $9,056 | $127,500 | $75,000 | $52,500 |
| 2018 | $8,887 | $127,500 | $75,000 | $52,500 |
| 2017 | $7,422 | $107,500 | $60,000 | $47,500 |
| 2016 | $7,407 | $107,500 | $60,000 | $47,500 |
| 2015 | $7,279 | $107,500 | $60,000 | $47,500 |
| 2014 | $7,121 | $107,500 | $60,000 | $47,500 |
Source: Public Records
Map
Nearby Homes