Estimated Value: $356,882 - $445,000
2
Beds
1
Bath
864
Sq Ft
$465/Sq Ft
Est. Value
About This Home
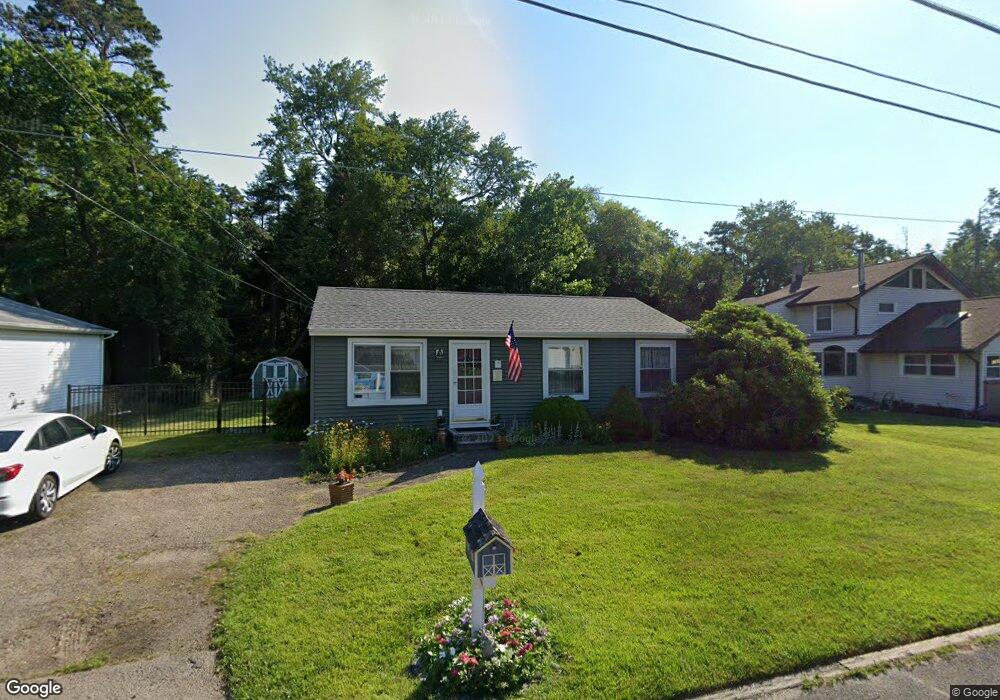
This home is located at 521 3rd Ave, Brick, NJ 08724 and is currently estimated at $401,971, approximately $465 per square foot. 521 3rd Ave is a home located in Ocean County with nearby schools including Veterans Memorial Elementary School, Veterans Memorial Middle School, and Brick Township Memorial High School.
Ownership History
Date
Name
Owned For
Owner Type
Purchase Details
Closed on
Dec 20, 2019
Sold by
Moynihan Kathleen Mary and Moynihan Hayley J
Bought by
Moynihan Kathleen Mary
Current Estimated Value
Purchase Details
Closed on
Nov 26, 2012
Sold by
Moynihan Kathleen Mary
Bought by
Moynihan Kathleen Mary and Moynihan Hayley J
Purchase Details
Closed on
May 10, 2001
Sold by
Gilmore Daniel
Bought by
Moynihan Kathleen
Home Financials for this Owner
Home Financials are based on the most recent Mortgage that was taken out on this home.
Original Mortgage
$50,000
Interest Rate
7.08%
Purchase Details
Closed on
Jul 18, 1996
Sold by
Pomponio Robert
Bought by
Gilmore Daniel and Gilmore Alison
Home Financials for this Owner
Home Financials are based on the most recent Mortgage that was taken out on this home.
Original Mortgage
$90,000
Interest Rate
8.28%
Create a Home Valuation Report for This Property
The Home Valuation Report is an in-depth analysis detailing your home's value as well as a comparison with similar homes in the area
Home Values in the Area
Average Home Value in this Area
Purchase History
| Date | Buyer | Sale Price | Title Company |
|---|---|---|---|
| Moynihan Kathleen Mary | -- | None Available | |
| Moynihan Kathleen Mary | -- | None Available | |
| Moynihan Kathleen | $113,000 | -- | |
| Moynihan Kathleen | $113,000 | -- | |
| Gilmore Daniel | $95,000 | -- |
Source: Public Records
Mortgage History
| Date | Status | Borrower | Loan Amount |
|---|---|---|---|
| Previous Owner | Moynihan Kathleen | $50,000 | |
| Previous Owner | Gilmore Daniel | $90,000 |
Source: Public Records
Tax History Compared to Growth
Tax History
| Year | Tax Paid | Tax Assessment Tax Assessment Total Assessment is a certain percentage of the fair market value that is determined by local assessors to be the total taxable value of land and additions on the property. | Land | Improvement |
|---|---|---|---|---|
| 2025 | $5,047 | $193,000 | $130,500 | $62,500 |
| 2024 | $4,798 | $193,000 | $130,500 | $62,500 |
| 2023 | $4,734 | $193,000 | $130,500 | $62,500 |
| 2022 | $4,734 | $193,000 | $130,500 | $62,500 |
| 2021 | $4,484 | $193,000 | $130,500 | $62,500 |
| 2020 | $4,574 | $193,000 | $130,500 | $62,500 |
| 2019 | $4,485 | $193,000 | $130,500 | $62,500 |
| 2018 | $4,383 | $193,000 | $130,500 | $62,500 |
| 2017 | $4,265 | $193,000 | $130,500 | $62,500 |
| 2016 | $4,234 | $193,000 | $130,500 | $62,500 |
| 2015 | $4,122 | $193,000 | $130,500 | $62,500 |
| 2014 | $4,082 | $193,000 | $130,500 | $62,500 |
Source: Public Records
Map
Nearby Homes
- 431 3rd Ave
- 658 Summit Ave
- 626-632 Summit Ave
- 65 Creek Rd Unit 419
- 389 Wilson Ct
- 445 Vista Ct
- 775 Maple Ave
- 411 Hulse Ave
- 36 Creek Rd Unit 36
- 136 Lilac Dr
- 26 River Edge Dr Unit 45
- 114 Bayview Ct Unit 125
- 524 Manasquan Ct
- 861 Wraight Ave
- 47 Marina Ln Unit 182
- 66 Breeze Ct Unit 97
- 79 Greenwood Loop Rd Unit 623
- 456 Rose Ave
- 94 Greenwood Loop Rd Unit 4A
- 2285 Lanes Mill Rd