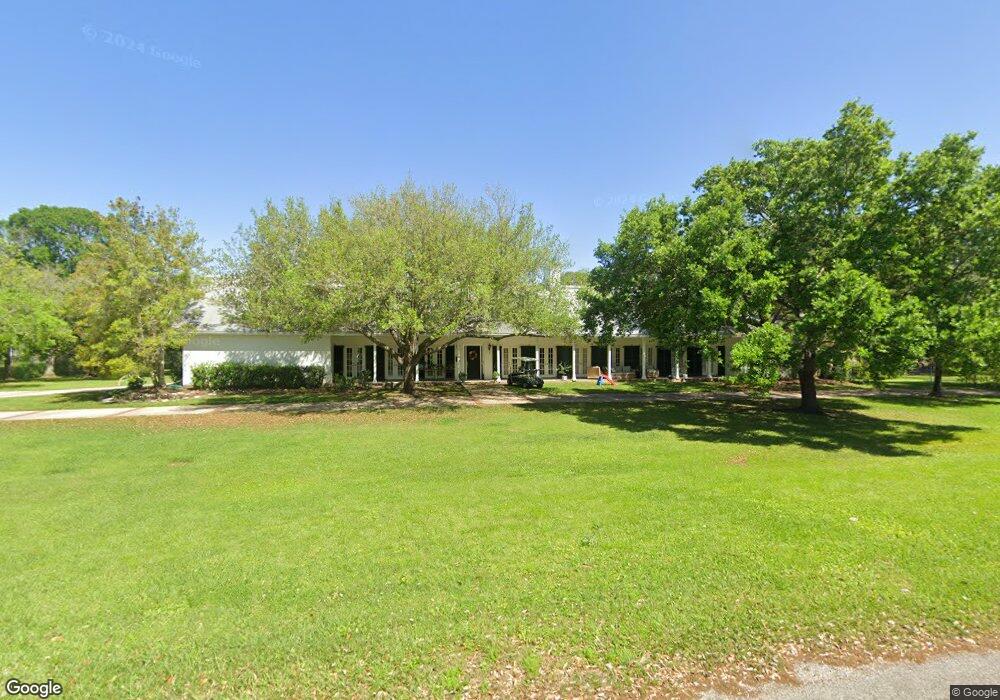
521 3rd St Bay City, TX 77414
Estimated Value: $229,000 - $348,000
2
Beds
3
Baths
2,277
Sq Ft
$135/Sq Ft
Est. Value
About This Home
This home is located at 521 3rd St, Bay City, TX 77414 and is currently estimated at $307,027, approximately $134 per square foot. 521 3rd St is a home located in Matagorda County with nearby schools including John H. Cherry Elementary School, Bay City Junior High School, and Bay City High School.
Ownership History
Date
Name
Owned For
Owner Type
Purchase Details
Closed on
Mar 7, 2018
Sold by
Mayfield William Kelly and Mayfield Sheri Saha
Bought by
Dickerson Caroline and Hawes Joan G
Current Estimated Value
Home Financials for this Owner
Home Financials are based on the most recent Mortgage that was taken out on this home.
Original Mortgage
$175,000
Outstanding Balance
$100,985
Interest Rate
4.15%
Mortgage Type
New Conventional
Estimated Equity
$206,042
Purchase Details
Closed on
Oct 19, 2011
Sold by
Bachman Richard C
Bought by
Mayfield William Kelly and Mayfield Sheri Sah
Home Financials for this Owner
Home Financials are based on the most recent Mortgage that was taken out on this home.
Original Mortgage
$222,705
Interest Rate
4.17%
Mortgage Type
FHA
Create a Home Valuation Report for This Property
The Home Valuation Report is an in-depth analysis detailing your home's value as well as a comparison with similar homes in the area
Home Values in the Area
Average Home Value in this Area
Purchase History
| Date | Buyer | Sale Price | Title Company |
|---|---|---|---|
| Dickerson Caroline | -- | Southwest Land & Title | |
| Mayfield William Kelly | -- | None Available |
Source: Public Records
Mortgage History
| Date | Status | Borrower | Loan Amount |
|---|---|---|---|
| Open | Dickerson Caroline | $175,000 | |
| Previous Owner | Mayfield William Kelly | $222,705 |
Source: Public Records
Tax History Compared to Growth
Tax History
| Year | Tax Paid | Tax Assessment Tax Assessment Total Assessment is a certain percentage of the fair market value that is determined by local assessors to be the total taxable value of land and additions on the property. | Land | Improvement |
|---|---|---|---|---|
| 2024 | $81 | $345,790 | $83,590 | $262,200 |
| 2023 | $7,751 | $332,670 | $60,950 | $271,720 |
| 2022 | $7,305 | $273,540 | $60,950 | $212,590 |
| 2021 | $8,109 | $275,990 | $60,950 | $215,040 |
| 2020 | $8,059 | $263,690 | $60,950 | $202,740 |
| 2019 | $8,124 | $265,970 | $60,950 | $205,020 |
| 2018 | $7,902 | $268,230 | $60,950 | $207,280 |
| 2017 | $7,553 | $270,530 | $60,950 | $209,580 |
| 2016 | $7,616 | $272,790 | $60,950 | $211,840 |
| 2015 | -- | $255,600 | $60,950 | $194,650 |
| 2014 | -- | $254,290 | $60,950 | $193,340 |
Source: Public Records
Map
Nearby Homes