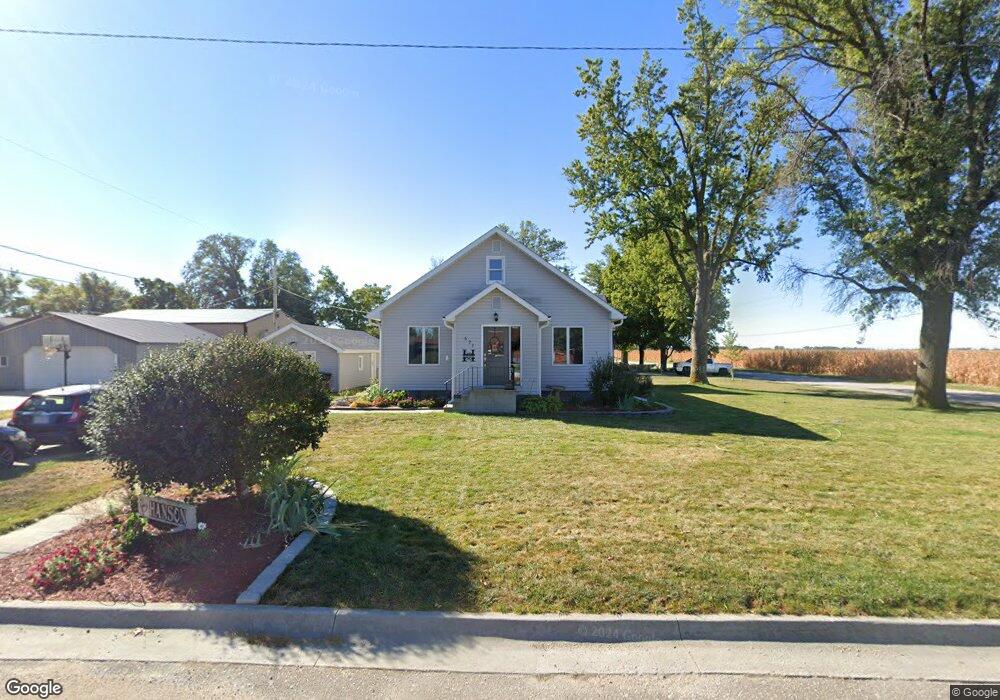
521 4th St Murdock, NE 68407
Estimated Value: $216,000 - $373,000
3
Beds
2
Baths
1,926
Sq Ft
$140/Sq Ft
Est. Value
About This Home
This home is located at 521 4th St, Murdock, NE 68407 and is currently estimated at $268,814, approximately $139 per square foot. 521 4th St is a home located in Cass County with nearby schools including Elmwood-Murdock Elementary School and Elmwood-Murdock Junior/Senior High School.
Ownership History
Date
Name
Owned For
Owner Type
Purchase Details
Closed on
May 16, 2016
Sold by
Hanson Michael L and Hanson Kimberlie J
Bought by
Hanson Michael L and Hanson Kimberlie J
Current Estimated Value
Home Financials for this Owner
Home Financials are based on the most recent Mortgage that was taken out on this home.
Original Mortgage
$260,387
Outstanding Balance
$209,573
Interest Rate
4.25%
Mortgage Type
FHA
Estimated Equity
$59,241
Create a Home Valuation Report for This Property
The Home Valuation Report is an in-depth analysis detailing your home's value as well as a comparison with similar homes in the area
Purchase History
| Date | Buyer | Sale Price | Title Company |
|---|---|---|---|
| Hanson Michael L | -- | None Available |
Source: Public Records
Mortgage History
| Date | Status | Borrower | Loan Amount |
|---|---|---|---|
| Open | Hanson Michael L | $260,387 |
Source: Public Records
Tax History
| Year | Tax Paid | Tax Assessment Tax Assessment Total Assessment is a certain percentage of the fair market value that is determined by local assessors to be the total taxable value of land and additions on the property. | Land | Improvement |
|---|---|---|---|---|
| 2025 | $2,123 | $167,480 | $19,330 | $148,150 |
| 2024 | $2,145 | $160,330 | $19,330 | $141,000 |
| 2023 | $2,627 | $156,372 | $16,802 | $139,570 |
| 2022 | $2,372 | $147,207 | $17,642 | $129,565 |
| 2021 | $1,871 | $112,381 | $13,901 | $98,480 |
| 2020 | $2,156 | $122,815 | $15,291 | $107,524 |
| 2019 | $1,972 | $111,650 | $13,901 | $97,749 |
| 2018 | $2,007 | $111,650 | $13,901 | $97,749 |
| 2017 | $2,013 | $111,650 | $13,901 | $97,749 |
| 2016 | $1,912 | $111,650 | $13,901 | $97,749 |
| 2015 | $1,823 | $110,023 | $19,639 | $90,384 |
| 2014 | $1,985 | $110,023 | $19,639 | $90,384 |
Source: Public Records
Map
Nearby Homes
- TBD Tbd
- 29320 Church Rd
- 0 Tbd 286th St
- Fletcher Ave Unit LotWP001
- TBD McKelvie Rd
- 12200 358th St
- 3250 310th St
- 3240 310th St
- 1.87 Acres, E H St
- 701 N 4th St
- TBD Alvo Rd
- 204 S 2nd St
- 437 E 2nd St
- 501 E 1st St
- 102 E 2nd St
- 204 Pawnee Cir
- 102 Oak Ln
- 36807 Oakmont Dr
- TBD-22-12-11 Northridge Sub (1 10 A) Pollard Dr
- 17750 Nebraska 31
Your Personal Tour Guide
Ask me questions while you tour the home.