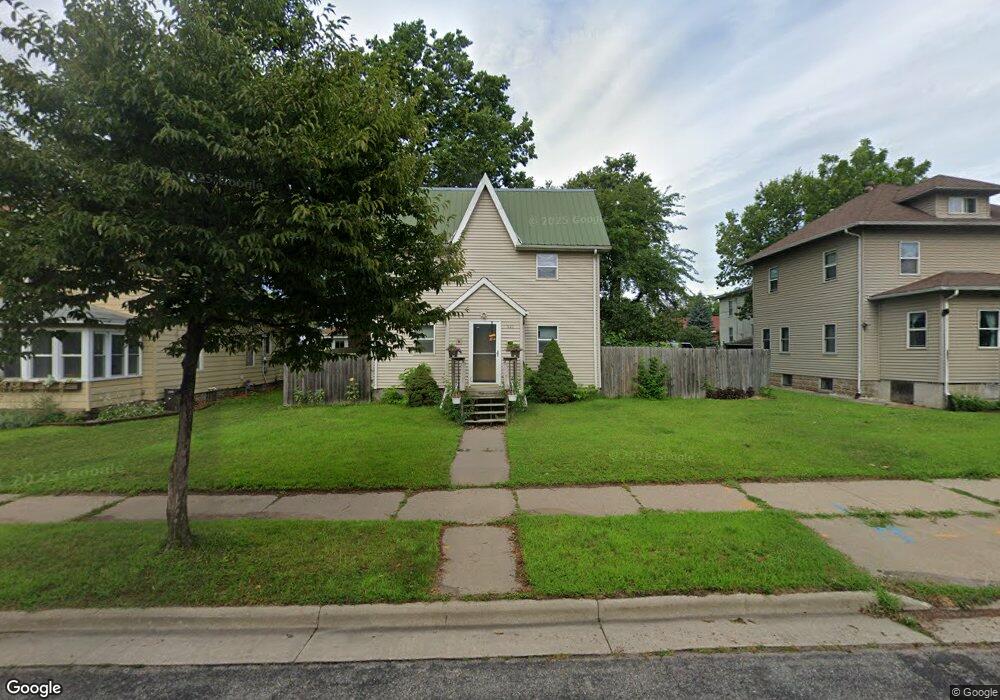
521 Avon St Unit 521 La Crosse, WI 54603
Lower Northside NeighborhoodEstimated Value: $209,940 - $282,000
4
Beds
2
Baths
1,536
Sq Ft
$154/Sq Ft
Est. Value
About This Home
This home is located at 521 Avon St Unit 521, La Crosse, WI 54603 and is currently estimated at $236,235, approximately $153 per square foot. 521 Avon St Unit 521 is a home located in La Crosse County with nearby schools including North Woods International School, Logan Middle School, and Logan High School.
Ownership History
Date
Name
Owned For
Owner Type
Purchase Details
Closed on
Dec 5, 2022
Sold by
Reis Mark
Bought by
Lee Susan
Current Estimated Value
Home Financials for this Owner
Home Financials are based on the most recent Mortgage that was taken out on this home.
Original Mortgage
$110,040
Outstanding Balance
$106,738
Interest Rate
6.95%
Mortgage Type
New Conventional
Estimated Equity
$129,497
Purchase Details
Closed on
Aug 16, 2018
Sold by
Tenkley Travis D and Tenkley Angela M
Bought by
Reis Mark
Home Financials for this Owner
Home Financials are based on the most recent Mortgage that was taken out on this home.
Original Mortgage
$122,735
Interest Rate
4.75%
Mortgage Type
FHA
Purchase Details
Closed on
Mar 26, 2007
Sold by
Charles Nicholas R and Charles Melissa A
Bought by
Tenkley Travis D and Tenkley Angela M
Home Financials for this Owner
Home Financials are based on the most recent Mortgage that was taken out on this home.
Original Mortgage
$111,500
Interest Rate
6.31%
Mortgage Type
New Conventional
Create a Home Valuation Report for This Property
The Home Valuation Report is an in-depth analysis detailing your home's value as well as a comparison with similar homes in the area
Home Values in the Area
Average Home Value in this Area
Purchase History
| Date | Buyer | Sale Price | Title Company |
|---|---|---|---|
| Lee Susan | $183,400 | -- | |
| Reis Mark | $125,000 | New Castle Title | |
| Tenkley Travis D | $111,500 | None Available |
Source: Public Records
Mortgage History
| Date | Status | Borrower | Loan Amount |
|---|---|---|---|
| Open | Lee Susan | $110,040 | |
| Previous Owner | Reis Mark | $122,735 | |
| Previous Owner | Tenkley Travis D | $111,500 |
Source: Public Records
Tax History Compared to Growth
Tax History
| Year | Tax Paid | Tax Assessment Tax Assessment Total Assessment is a certain percentage of the fair market value that is determined by local assessors to be the total taxable value of land and additions on the property. | Land | Improvement |
|---|---|---|---|---|
| 2023 | $3,736 | $184,400 | $12,500 | $171,900 |
| 2022 | $3,471 | $180,600 | $12,500 | $168,100 |
| 2021 | $3,374 | $132,300 | $12,500 | $119,800 |
| 2020 | $3,317 | $132,300 | $12,500 | $119,800 |
| 2019 | $3,315 | $132,300 | $12,500 | $119,800 |
| 2018 | $2,990 | $105,200 | $15,200 | $90,000 |
| 2017 | $2,719 | $96,500 | $15,200 | $81,300 |
| 2016 | $2,808 | $96,500 | $15,200 | $81,300 |
Source: Public Records
Map
Nearby Homes