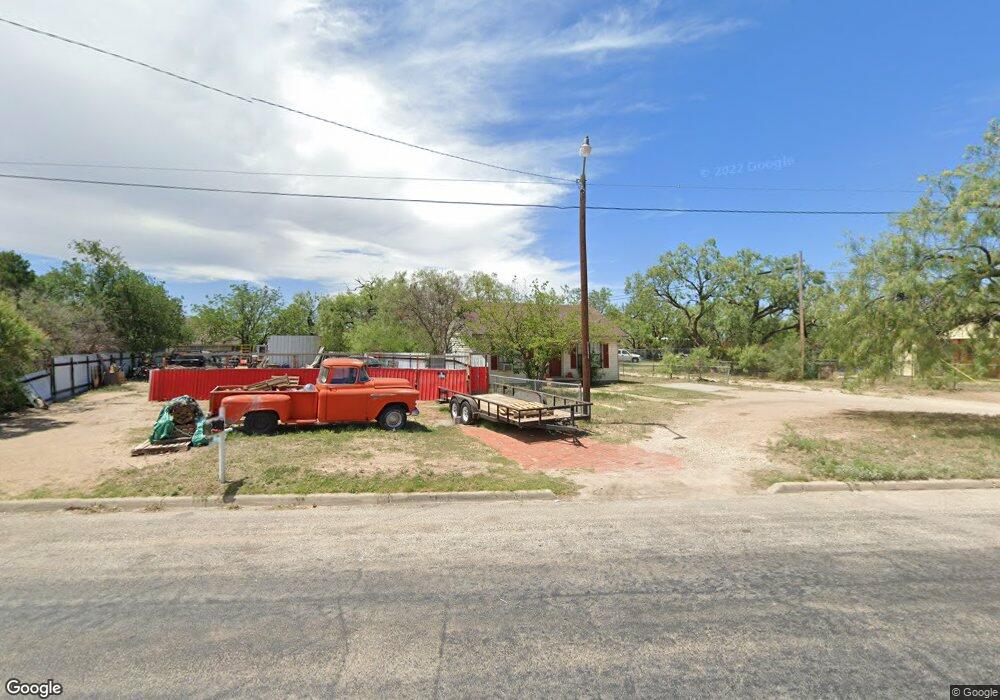
521 Baker St San Angelo, TX 76903
Fort Concho NeighborhoodEstimated Value: $81,000 - $97,000
--
Bed
--
Bath
672
Sq Ft
$130/Sq Ft
Est. Value
About This Home
This home is located at 521 Baker St, San Angelo, TX 76903 and is currently estimated at $87,620, approximately $130 per square foot. 521 Baker St is a home located in Tom Green County with nearby schools including Ft. Concho Elementary School, Glenn Middle School, and Central High School.
Ownership History
Date
Name
Owned For
Owner Type
Purchase Details
Closed on
May 1, 2025
Sold by
Peace Rock Properties 1 Llc
Bought by
Red Ram Llc
Current Estimated Value
Home Financials for this Owner
Home Financials are based on the most recent Mortgage that was taken out on this home.
Original Mortgage
$62,500
Interest Rate
6.77%
Mortgage Type
Seller Take Back
Purchase Details
Closed on
Jul 26, 2023
Sold by
Smith Della Lynn
Bought by
Peace Rock Properties 1 Llc
Purchase Details
Closed on
Jul 27, 2022
Sold by
Jensen and Sherry
Bought by
Albertelli Joanne P
Purchase Details
Closed on
Jun 13, 2005
Sold by
Revira Pedro Aguirre and Revira Anna M
Bought by
Jensen David
Purchase Details
Closed on
Mar 14, 1997
Sold by
Revira Eva
Bought by
Jensen David
Create a Home Valuation Report for This Property
The Home Valuation Report is an in-depth analysis detailing your home's value as well as a comparison with similar homes in the area
Home Values in the Area
Average Home Value in this Area
Purchase History
| Date | Buyer | Sale Price | Title Company |
|---|---|---|---|
| Red Ram Llc | -- | None Listed On Document | |
| Peace Rock Properties 1 Llc | -- | None Listed On Document | |
| Albertelli Joanne P | -- | -- | |
| Jensen David | -- | None Available | |
| Jensen David | -- | -- |
Source: Public Records
Mortgage History
| Date | Status | Borrower | Loan Amount |
|---|---|---|---|
| Previous Owner | Red Ram Llc | $62,500 |
Source: Public Records
Tax History Compared to Growth
Tax History
| Year | Tax Paid | Tax Assessment Tax Assessment Total Assessment is a certain percentage of the fair market value that is determined by local assessors to be the total taxable value of land and additions on the property. | Land | Improvement |
|---|---|---|---|---|
| 2025 | $1,128 | $55,300 | $29,520 | $25,780 |
| 2024 | $975 | $49,000 | $29,520 | $19,480 |
| 2023 | $1,085 | $54,527 | $37,990 | $16,537 |
| 2022 | $553 | $22,810 | $11,310 | $11,500 |
| 2021 | $339 | $13,840 | $0 | $0 |
| 2020 | $340 | $13,840 | $5,000 | $8,840 |
| 2019 | $350 | $13,840 | $5,000 | $8,840 |
| 2018 | $354 | $14,030 | $5,000 | $9,030 |
| 2017 | $409 | $16,290 | $5,000 | $11,290 |
| 2016 | $409 | $16,290 | $5,000 | $11,290 |
| 2015 | $462 | $18,310 | $5,000 | $13,310 |
| 2014 | $469 | $18,310 | $5,000 | $13,310 |
| 2013 | $394 | $15,400 | $0 | $0 |
Source: Public Records
Map
Nearby Homes
- 625 Powell St
- 626 Parsons St
- 124 Bird St
- 0 Allen St Unit 6
- 210 S Baze St Unit 3
- 206 S Baze St Unit 2
- 1334 Tres Rios Cir
- 415 E Harris Ave
- 1242 Tres Rios Dr
- 1516 E Harris Ave
- 812 E Harris Ave
- 210 W Avenue B
- 110 N Pope St
- 1518 Mayse St
- 119 N Malone St
- 1218 Toby Ln
- 1129 Todd Ln
- 407 Koberlin St
- 1517 Culberson St
- 5202 Riviera Ln