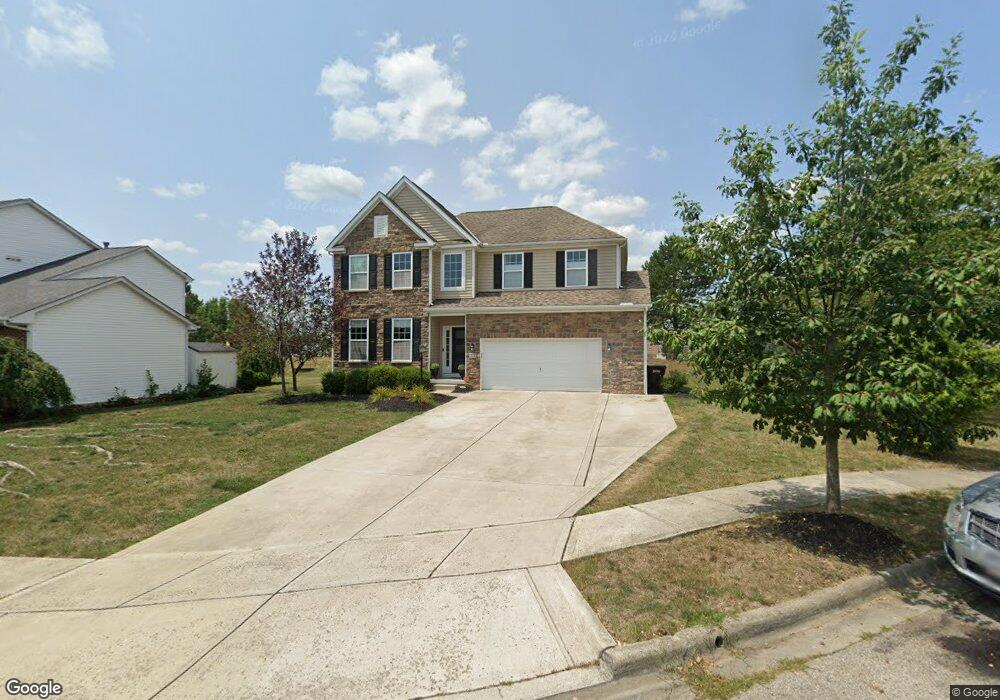
521 Banbridge Ct Pickerington, OH 43147
Estimated Value: $522,000 - $557,000
4
Beds
4
Baths
3,080
Sq Ft
$176/Sq Ft
Est. Value
About This Home
This home is located at 521 Banbridge Ct, Pickerington, OH 43147 and is currently estimated at $541,040, approximately $175 per square foot. 521 Banbridge Ct is a home with nearby schools including Sycamore Creek Elementary School, Diley Middle School, and Pickerington Ridgeview Junior High School.
Ownership History
Date
Name
Owned For
Owner Type
Purchase Details
Closed on
Jul 25, 2013
Sold by
Westport Homes Inc
Bought by
Culp Kevin R and Culp Raquel Upshaw
Current Estimated Value
Home Financials for this Owner
Home Financials are based on the most recent Mortgage that was taken out on this home.
Original Mortgage
$279,198
Outstanding Balance
$200,036
Interest Rate
3.5%
Mortgage Type
FHA
Estimated Equity
$341,004
Purchase Details
Closed on
Aug 31, 2010
Sold by
Dunmoor Investment Limited Liability Com
Bought by
Westport Homes Inc
Home Financials for this Owner
Home Financials are based on the most recent Mortgage that was taken out on this home.
Original Mortgage
$28,000,000
Interest Rate
4.6%
Mortgage Type
Future Advance Clause Open End Mortgage
Purchase Details
Closed on
Mar 30, 2006
Sold by
Centex Homes
Bought by
Dunmoor Investment Llc
Home Financials for this Owner
Home Financials are based on the most recent Mortgage that was taken out on this home.
Original Mortgage
$1,400,000
Interest Rate
6.33%
Mortgage Type
Purchase Money Mortgage
Create a Home Valuation Report for This Property
The Home Valuation Report is an in-depth analysis detailing your home's value as well as a comparison with similar homes in the area
Home Values in the Area
Average Home Value in this Area
Purchase History
| Date | Buyer | Sale Price | Title Company |
|---|---|---|---|
| Culp Kevin R | $284,400 | Talon Title W | |
| Westport Homes Inc | $780,000 | None Available | |
| Dunmoor Investment Llc | $1,694,000 | Talon Group |
Source: Public Records
Mortgage History
| Date | Status | Borrower | Loan Amount |
|---|---|---|---|
| Open | Culp Kevin R | $279,198 | |
| Previous Owner | Westport Homes Inc | $28,000,000 | |
| Previous Owner | Dunmoor Investment Llc | $1,400,000 |
Source: Public Records
Tax History Compared to Growth
Tax History
| Year | Tax Paid | Tax Assessment Tax Assessment Total Assessment is a certain percentage of the fair market value that is determined by local assessors to be the total taxable value of land and additions on the property. | Land | Improvement |
|---|---|---|---|---|
| 2024 | $19,490 | $158,330 | $18,600 | $139,730 |
| 2023 | $7,464 | $158,330 | $18,600 | $139,730 |
| 2022 | $7,489 | $158,330 | $18,600 | $139,730 |
| 2021 | $6,846 | $123,260 | $16,170 | $107,090 |
| 2020 | $6,921 | $123,260 | $16,170 | $107,090 |
| 2019 | $6,964 | $123,260 | $16,170 | $107,090 |
| 2018 | $6,403 | $100,880 | $16,170 | $84,710 |
| 2017 | $6,413 | $98,790 | $14,080 | $84,710 |
| 2016 | $6,380 | $98,790 | $14,080 | $84,710 |
| 2015 | $6,277 | $91,900 | $14,080 | $77,820 |
| 2014 | $6,201 | $91,900 | $14,080 | $77,820 |
| 2013 | $6,201 | $14,080 | $14,080 | $0 |
Source: Public Records
Map
Nearby Homes
- 551 Stonebridge Blvd
- 595 Banbridge St
- 545 W Columbus St
- 783 W Columbus St
- 641 Preston Trails Dr
- 620 Brighton St
- 481 Rambling Brook Dr
- Edgewood Plan at The Reserve at Pickerington Ponds - Reserve
- Palmetto Plan at The Reserve at Pickerington Ponds - Reserve
- Galveston Plan at The Reserve at Pickerington Ponds - Reserve
- Manchester Plan at The Reserve at Pickerington Ponds - Reserve
- McKenzie Plan at The Reserve at Pickerington Ponds - Reserve
- Augustine Plan at The Reserve at Pickerington Ponds - Reserve
- Stonehurst Plan at The Reserve at Pickerington Ponds - Reserve
- Aberdeen Plan at The Reserve at Pickerington Ponds - Reserve
- Sanibel Plan at The Reserve at Pickerington Ponds - Reserve
- Bradenton Plan at The Reserve at Pickerington Ponds - Reserve
- Barrington Plan at The Reserve at Pickerington Ponds - Reserve
- Biscayne Plan at The Reserve at Pickerington Ponds - Reserve
- Lauderdale Plan at The Reserve at Pickerington Ponds - Reserve
- 517 Banbridge Ct
- 525 Banbridge Ct
- 513 Banbridge Ct
- 520 Banbridge Ct
- 512 Banbridge Ct
- 516 Banbridge Ct
- 668 Isabel Ct
- 511 Banbridge Ct
- 504 Banbridge Ct
- 507 Banbridge Ct
- 678 Isabel Ct
- 679 Isabel Ct
- 503 Banbridge Ct
- 532 Stonebridge Blvd
- 579 Cranborn Ct
- 776 Manchester Ct
- 508 Chatham Ct
- 568 Cranborn Ct
- 769 Manchester Ct
- 504 Chatham Ct