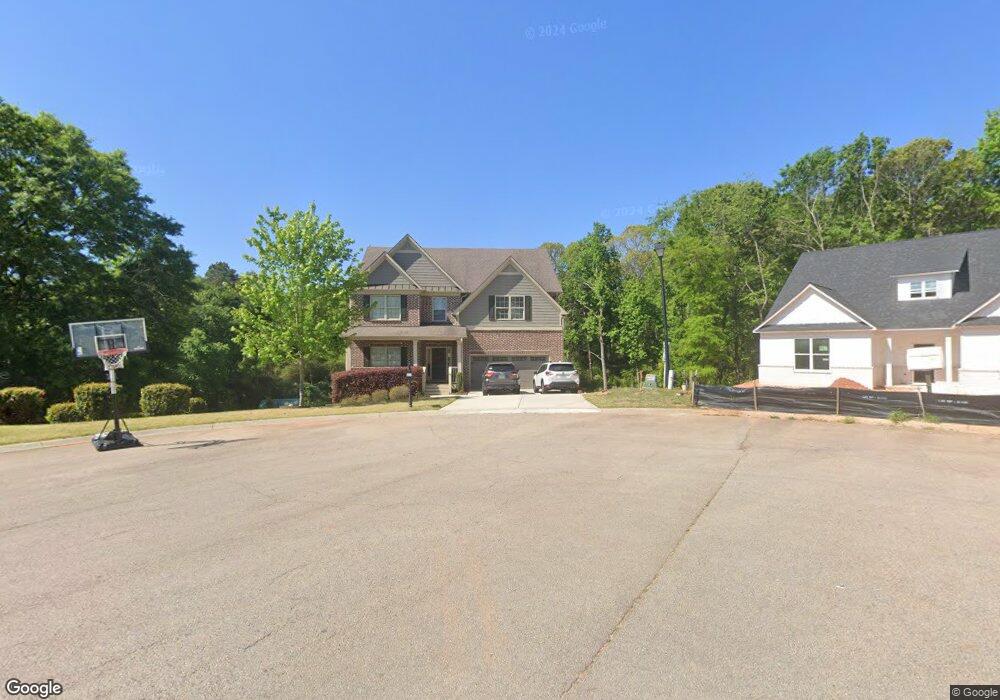
521 Belaire Dr Unit 17 Winder, GA 30680
Estimated Value: $490,696 - $539,000
4
Beds
3
Baths
2,800
Sq Ft
$184/Sq Ft
Est. Value
About This Home
This home is located at 521 Belaire Dr Unit 17, Winder, GA 30680 and is currently estimated at $514,674, approximately $183 per square foot. 521 Belaire Dr Unit 17 is a home located in Barrow County with nearby schools including Holsenbeck Elementary School, Bear Creek Middle School, and Winder-Barrow High School.
Ownership History
Date
Name
Owned For
Owner Type
Purchase Details
Closed on
Nov 30, 2020
Sold by
Oshield Sarah Valdese
Bought by
Prokopchuk Pavlo and Prokopchuk Tetyana
Current Estimated Value
Home Financials for this Owner
Home Financials are based on the most recent Mortgage that was taken out on this home.
Original Mortgage
$272,000
Outstanding Balance
$241,092
Interest Rate
2.8%
Mortgage Type
New Conventional
Estimated Equity
$273,582
Purchase Details
Closed on
Sep 13, 2017
Sold by
Oshield Michael Stanley
Bought by
Oshield Sarah Valdese
Purchase Details
Closed on
Jan 13, 2017
Sold by
Lexes Homes Inc
Bought by
Oshield Michael S and Sarah Oshield V
Home Financials for this Owner
Home Financials are based on the most recent Mortgage that was taken out on this home.
Original Mortgage
$265,010
Interest Rate
4.25%
Mortgage Type
FHA
Purchase Details
Closed on
Jul 16, 2014
Sold by
Progressive Realty Llc
Bought by
Jackson Ridge Llc
Create a Home Valuation Report for This Property
The Home Valuation Report is an in-depth analysis detailing your home's value as well as a comparison with similar homes in the area
Home Values in the Area
Average Home Value in this Area
Purchase History
| Date | Buyer | Sale Price | Title Company |
|---|---|---|---|
| Prokopchuk Pavlo | $340,000 | -- | |
| Oshield Sarah Valdese | $10,000 | -- | |
| Oshield Michael S | $269,900 | -- | |
| Jackson Ridge Llc | $80,500 | -- | |
| Jp Squared Llc | $92,000 | -- |
Source: Public Records
Mortgage History
| Date | Status | Borrower | Loan Amount |
|---|---|---|---|
| Open | Prokopchuk Pavlo | $272,000 | |
| Previous Owner | Oshield Michael S | $265,010 |
Source: Public Records
Tax History Compared to Growth
Tax History
| Year | Tax Paid | Tax Assessment Tax Assessment Total Assessment is a certain percentage of the fair market value that is determined by local assessors to be the total taxable value of land and additions on the property. | Land | Improvement |
|---|---|---|---|---|
| 2024 | $4,916 | $178,234 | $38,000 | $140,234 |
| 2023 | $4,408 | $178,234 | $38,000 | $140,234 |
| 2022 | $4,792 | $146,466 | $28,800 | $117,666 |
| 2021 | $4,208 | $122,903 | $24,000 | $98,903 |
| 2020 | $3,878 | $114,609 | $24,000 | $90,609 |
| 2019 | $3,933 | $114,609 | $24,000 | $90,609 |
| 2018 | $3,705 | $110,609 | $20,000 | $90,609 |
| 2017 | $3,096 | $103,774 | $20,000 | $83,774 |
| 2016 | $3,367 | $100,392 | $24,000 | $76,392 |
| 2015 | $315 | $8,000 | $8,000 | $0 |
| 2014 | $183 | $5,460 | $5,460 | $0 |
| 2013 | -- | $5,460 | $5,460 | $0 |
Source: Public Records
Map
Nearby Homes
- 521 Belaire Dr
- 523 Belaire Dr
- 193 Belaire Ct
- 520 Belaire Dr
- 195 Belaire Ct
- 522 Belaire Dr
- 1635 Jasper Dr
- 527 Belaire Dr
- 1637 Jasper Dr
- 524 Belaire Dr
- 1633 Jasper Dr
- 1633 Jasper Dr Unit 66
- 1631 Jasper Dr
- 194 Belaire Ct
- 1639 Jasper Dr
- 526 Belaire Dr
- 1629 Jasper Dr
- 1641 Jasper Dr Unit 62
- 1641 Jasper Dr
- 529 Belaire Dr Unit 2