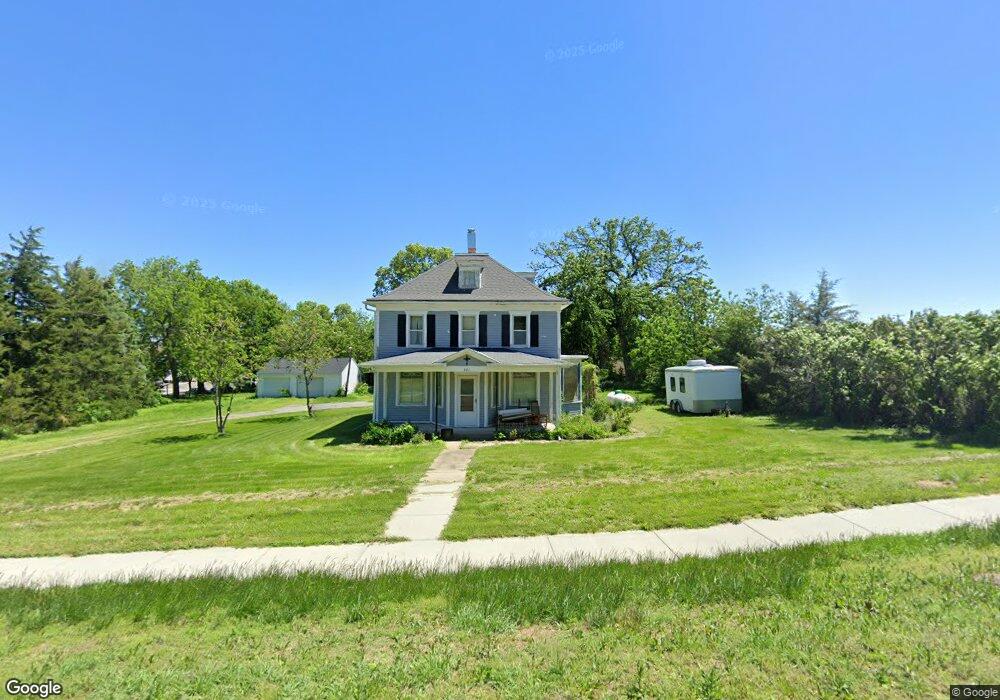
521 Bryan St Clarkson, NE 68629
Estimated Value: $65,068 - $132,000
4
Beds
1
Bath
1,572
Sq Ft
$63/Sq Ft
Est. Value
About This Home
This home is located at 521 Bryan St, Clarkson, NE 68629 and is currently estimated at $99,267, approximately $63 per square foot. 521 Bryan St is a home located in Colfax County with nearby schools including Clarkson Elementary School, Clarkson Junior/Senior High School, and St John Neumann Catholic Elementary School.
Ownership History
Date
Name
Owned For
Owner Type
Purchase Details
Closed on
Apr 25, 2008
Sold by
Howkins Helen A and Howkins Robert D
Bought by
Kleensang Lonnie L and Kleensang Clare E
Current Estimated Value
Home Financials for this Owner
Home Financials are based on the most recent Mortgage that was taken out on this home.
Original Mortgage
$14,400
Outstanding Balance
$9,060
Interest Rate
5.84%
Mortgage Type
New Conventional
Estimated Equity
$90,207
Purchase Details
Closed on
Apr 14, 2008
Sold by
Hawkins Gary L
Bought by
Kleensang Lonnie L and Kleensang Clare E
Home Financials for this Owner
Home Financials are based on the most recent Mortgage that was taken out on this home.
Original Mortgage
$14,400
Outstanding Balance
$9,060
Interest Rate
5.84%
Mortgage Type
New Conventional
Estimated Equity
$90,207
Create a Home Valuation Report for This Property
The Home Valuation Report is an in-depth analysis detailing your home's value as well as a comparison with similar homes in the area
Purchase History
| Date | Buyer | Sale Price | Title Company |
|---|---|---|---|
| Kleensang Lonnie L | $18,000 | -- | |
| Kleensang Lonnie L | -- | -- | |
| Kleensang Lonnie L | -- | -- | |
| Kleensburg Lonnie L | -- | -- |
Source: Public Records
Mortgage History
| Date | Status | Borrower | Loan Amount |
|---|---|---|---|
| Open | Kleensang Lonnie L | $14,400 |
Source: Public Records
Tax History
| Year | Tax Paid | Tax Assessment Tax Assessment Total Assessment is a certain percentage of the fair market value that is determined by local assessors to be the total taxable value of land and additions on the property. | Land | Improvement |
|---|---|---|---|---|
| 2025 | $530 | $37,170 | $12,305 | $24,865 |
| 2024 | $373 | $36,760 | $12,305 | $24,455 |
| 2023 | $373 | $24,580 | $12,305 | $12,275 |
| 2022 | $380 | $23,840 | $12,305 | $11,535 |
| 2021 | $360 | $22,350 | $12,305 | $10,045 |
| 2020 | $361 | $22,350 | $12,305 | $10,045 |
| 2019 | $298 | $18,605 | $8,560 | $10,045 |
| 2018 | $304 | $18,905 | $8,560 | $10,345 |
| 2017 | $290 | $17,640 | $8,560 | $9,080 |
| 2016 | $288 | $17,640 | $8,560 | $9,080 |
| 2015 | $294 | $17,640 | $8,560 | $9,080 |
| 2014 | $355 | $18,600 | $8,560 | $10,040 |
Source: Public Records
Map
Nearby Homes
Your Personal Tour Guide
Ask me questions while you tour the home.