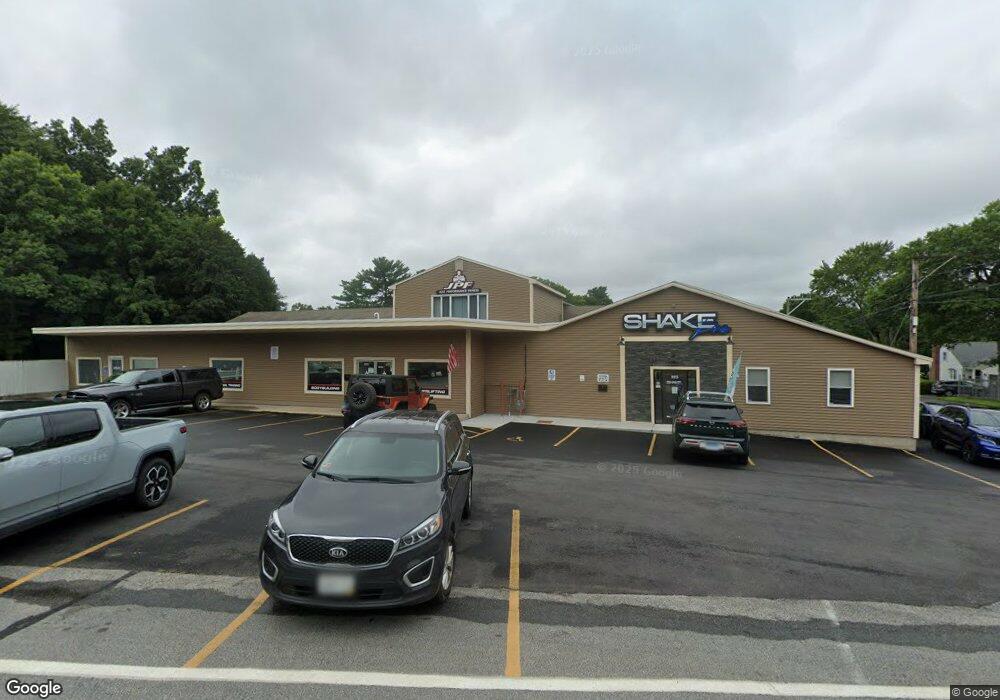
521 Davis Rd Danielson, CT 06239
Estimated Value: $256,000
Studio
--
Bath
15,873
Sq Ft
$16/Sq Ft
Est. Value
About This Home
This home is located at 521 Davis Rd, Danielson, CT 06239 and is currently priced at $256,000, approximately $16 per square foot. 521 Davis Rd is a home located in Windham County with nearby schools including Killingly Central School, Killingly Memorial School, and Killingly Intermediate School.
Ownership History
Date
Name
Owned For
Owner Type
Purchase Details
Closed on
Jun 12, 2017
Sold by
H & Ndevelopment Group L
Bought by
Jp Realty Holdings Llc
Current Estimated Value
Home Financials for this Owner
Home Financials are based on the most recent Mortgage that was taken out on this home.
Original Mortgage
$164,800
Interest Rate
4.03%
Mortgage Type
Commercial
Purchase Details
Closed on
Sep 1, 2016
Sold by
Northeast Real Estate
Bought by
H & N Development Group
Purchase Details
Closed on
Jun 14, 2016
Sold by
Tillinghast Andrew E
Bought by
Watson Noel
Create a Home Valuation Report for This Property
The Home Valuation Report is an in-depth analysis detailing your home's value as well as a comparison with similar homes in the area
Home Values in the Area
Average Home Value in this Area
Purchase History
| Date | Buyer | Sale Price | Title Company |
|---|---|---|---|
| Jp Realty Holdings Llc | -- | -- | |
| Jp Realty Holdings Llc | -- | -- | |
| H & N Development Group | -- | -- | |
| H & N Development Group | -- | -- | |
| Watson Noel | -- | -- | |
| Watson Noel | -- | -- |
Source: Public Records
Mortgage History
| Date | Status | Borrower | Loan Amount |
|---|---|---|---|
| Open | Watson Noel | $172,000 | |
| Closed | Watson Noel | $164,800 |
Source: Public Records
Tax History
| Year | Tax Paid | Tax Assessment Tax Assessment Total Assessment is a certain percentage of the fair market value that is determined by local assessors to be the total taxable value of land and additions on the property. | Land | Improvement |
|---|---|---|---|---|
| 2025 | $10,937 | $466,410 | $87,360 | $379,050 |
| 2024 | $10,294 | $466,410 | $87,360 | $379,050 |
| 2023 | $9,879 | $344,820 | $72,800 | $272,020 |
| 2022 | $9,279 | $344,820 | $72,800 | $272,020 |
| 2021 | $10,519 | $390,880 | $72,800 | $318,080 |
| 2020 | $9,083 | $344,820 | $72,800 | $272,020 |
| 2019 | $10,499 | $390,880 | $72,800 | $318,080 |
| 2017 | $8,582 | $293,790 | $72,800 | $220,990 |
| 2016 | $8,569 | $294,350 | $72,800 | $221,550 |
| 2015 | $8,627 | $294,350 | $72,800 | $221,550 |
| 2014 | $8,392 | $294,350 | $72,800 | $221,550 |
Source: Public Records
Map
Nearby Homes
- 48 Athol St Unit 48
- 74 Athol St
- 63 Athol St
- 144 Prospect Ave
- 61 Deerwood Dr
- 10 Conrad's Park
- 73 Hawkins St
- 10 Center St
- 24 Center St
- 133 Maple St
- 14 Valley View Dr
- 16 Valley View Dr
- 102 Cottage St
- 85 Mashentuck Rd
- 37 Ruth St
- 150 Broad St
- 135 Adelaide St
- 85 Furnace St
- 37 Katherine Ave
- 175 Mashentuck Rd
Your Personal Tour Guide
Ask me questions while you tour the home.